Data sources
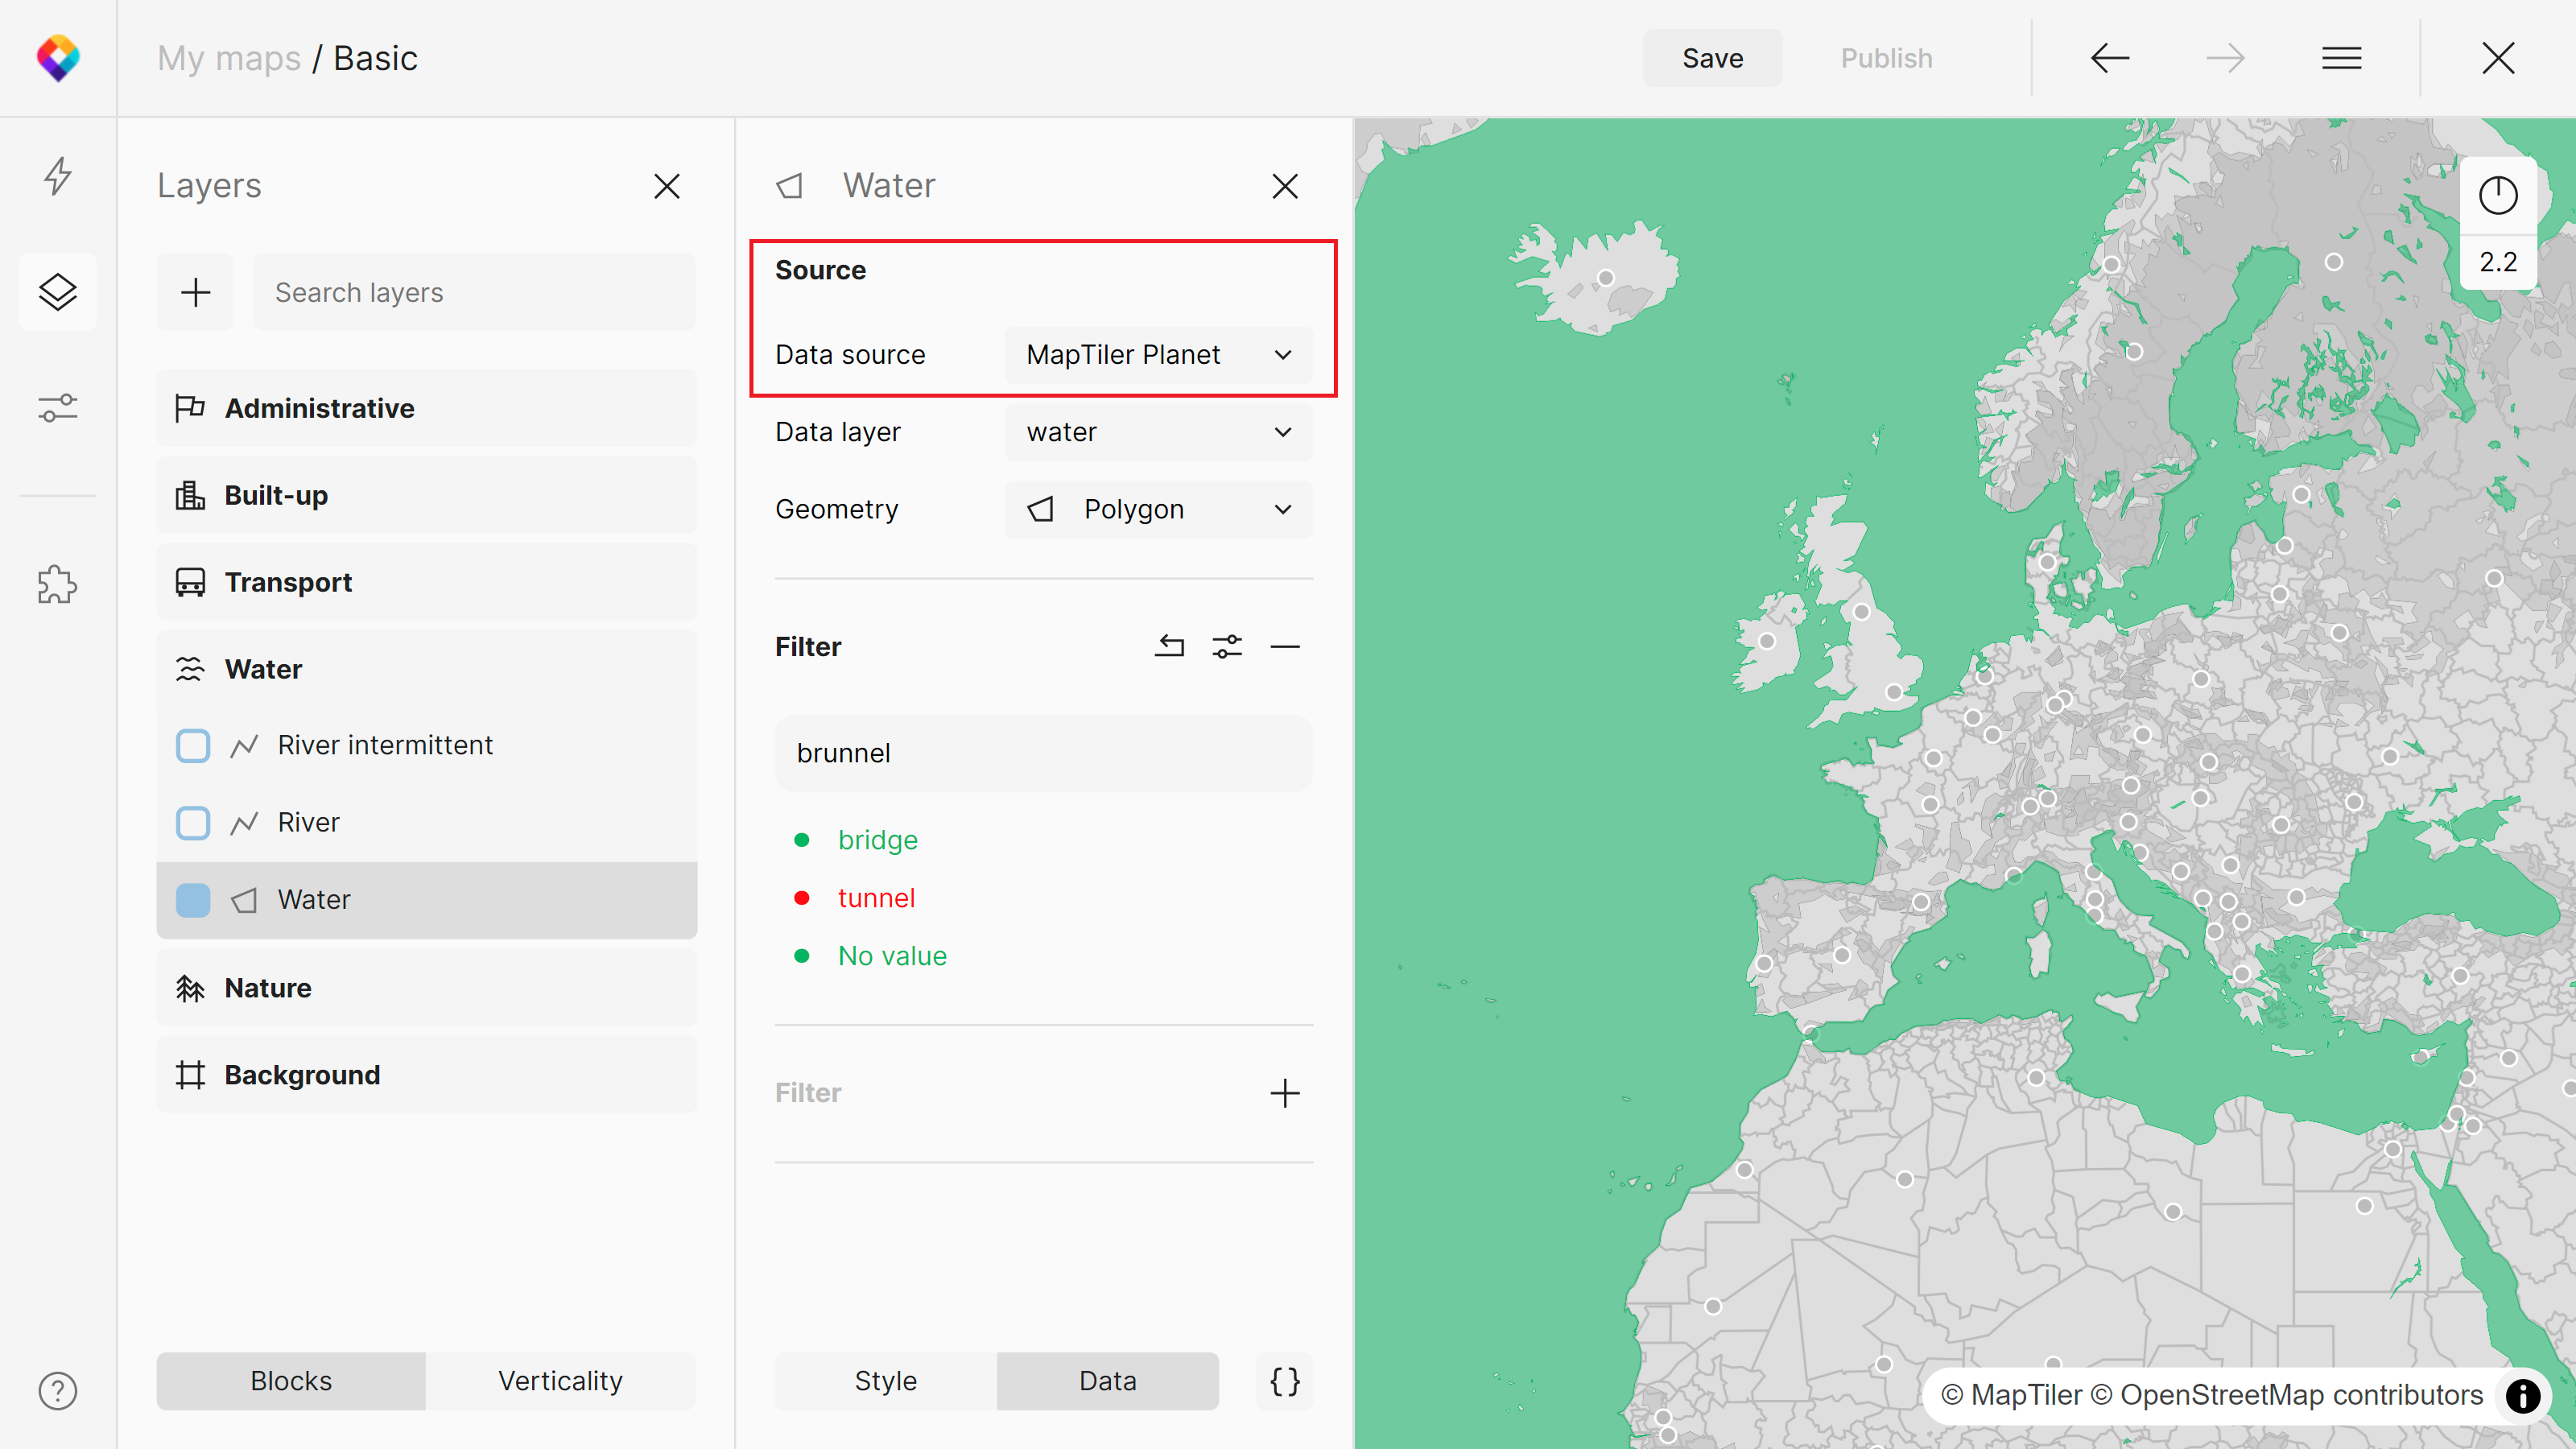
A data source is the backbone of each map. Data defines the features that are visible on the map and that you can style according to your needs. Each style layer in your map has a defined source. In MapTiler Map Designer, you can find the data source used for a specific layer in the Data tab under Sources.
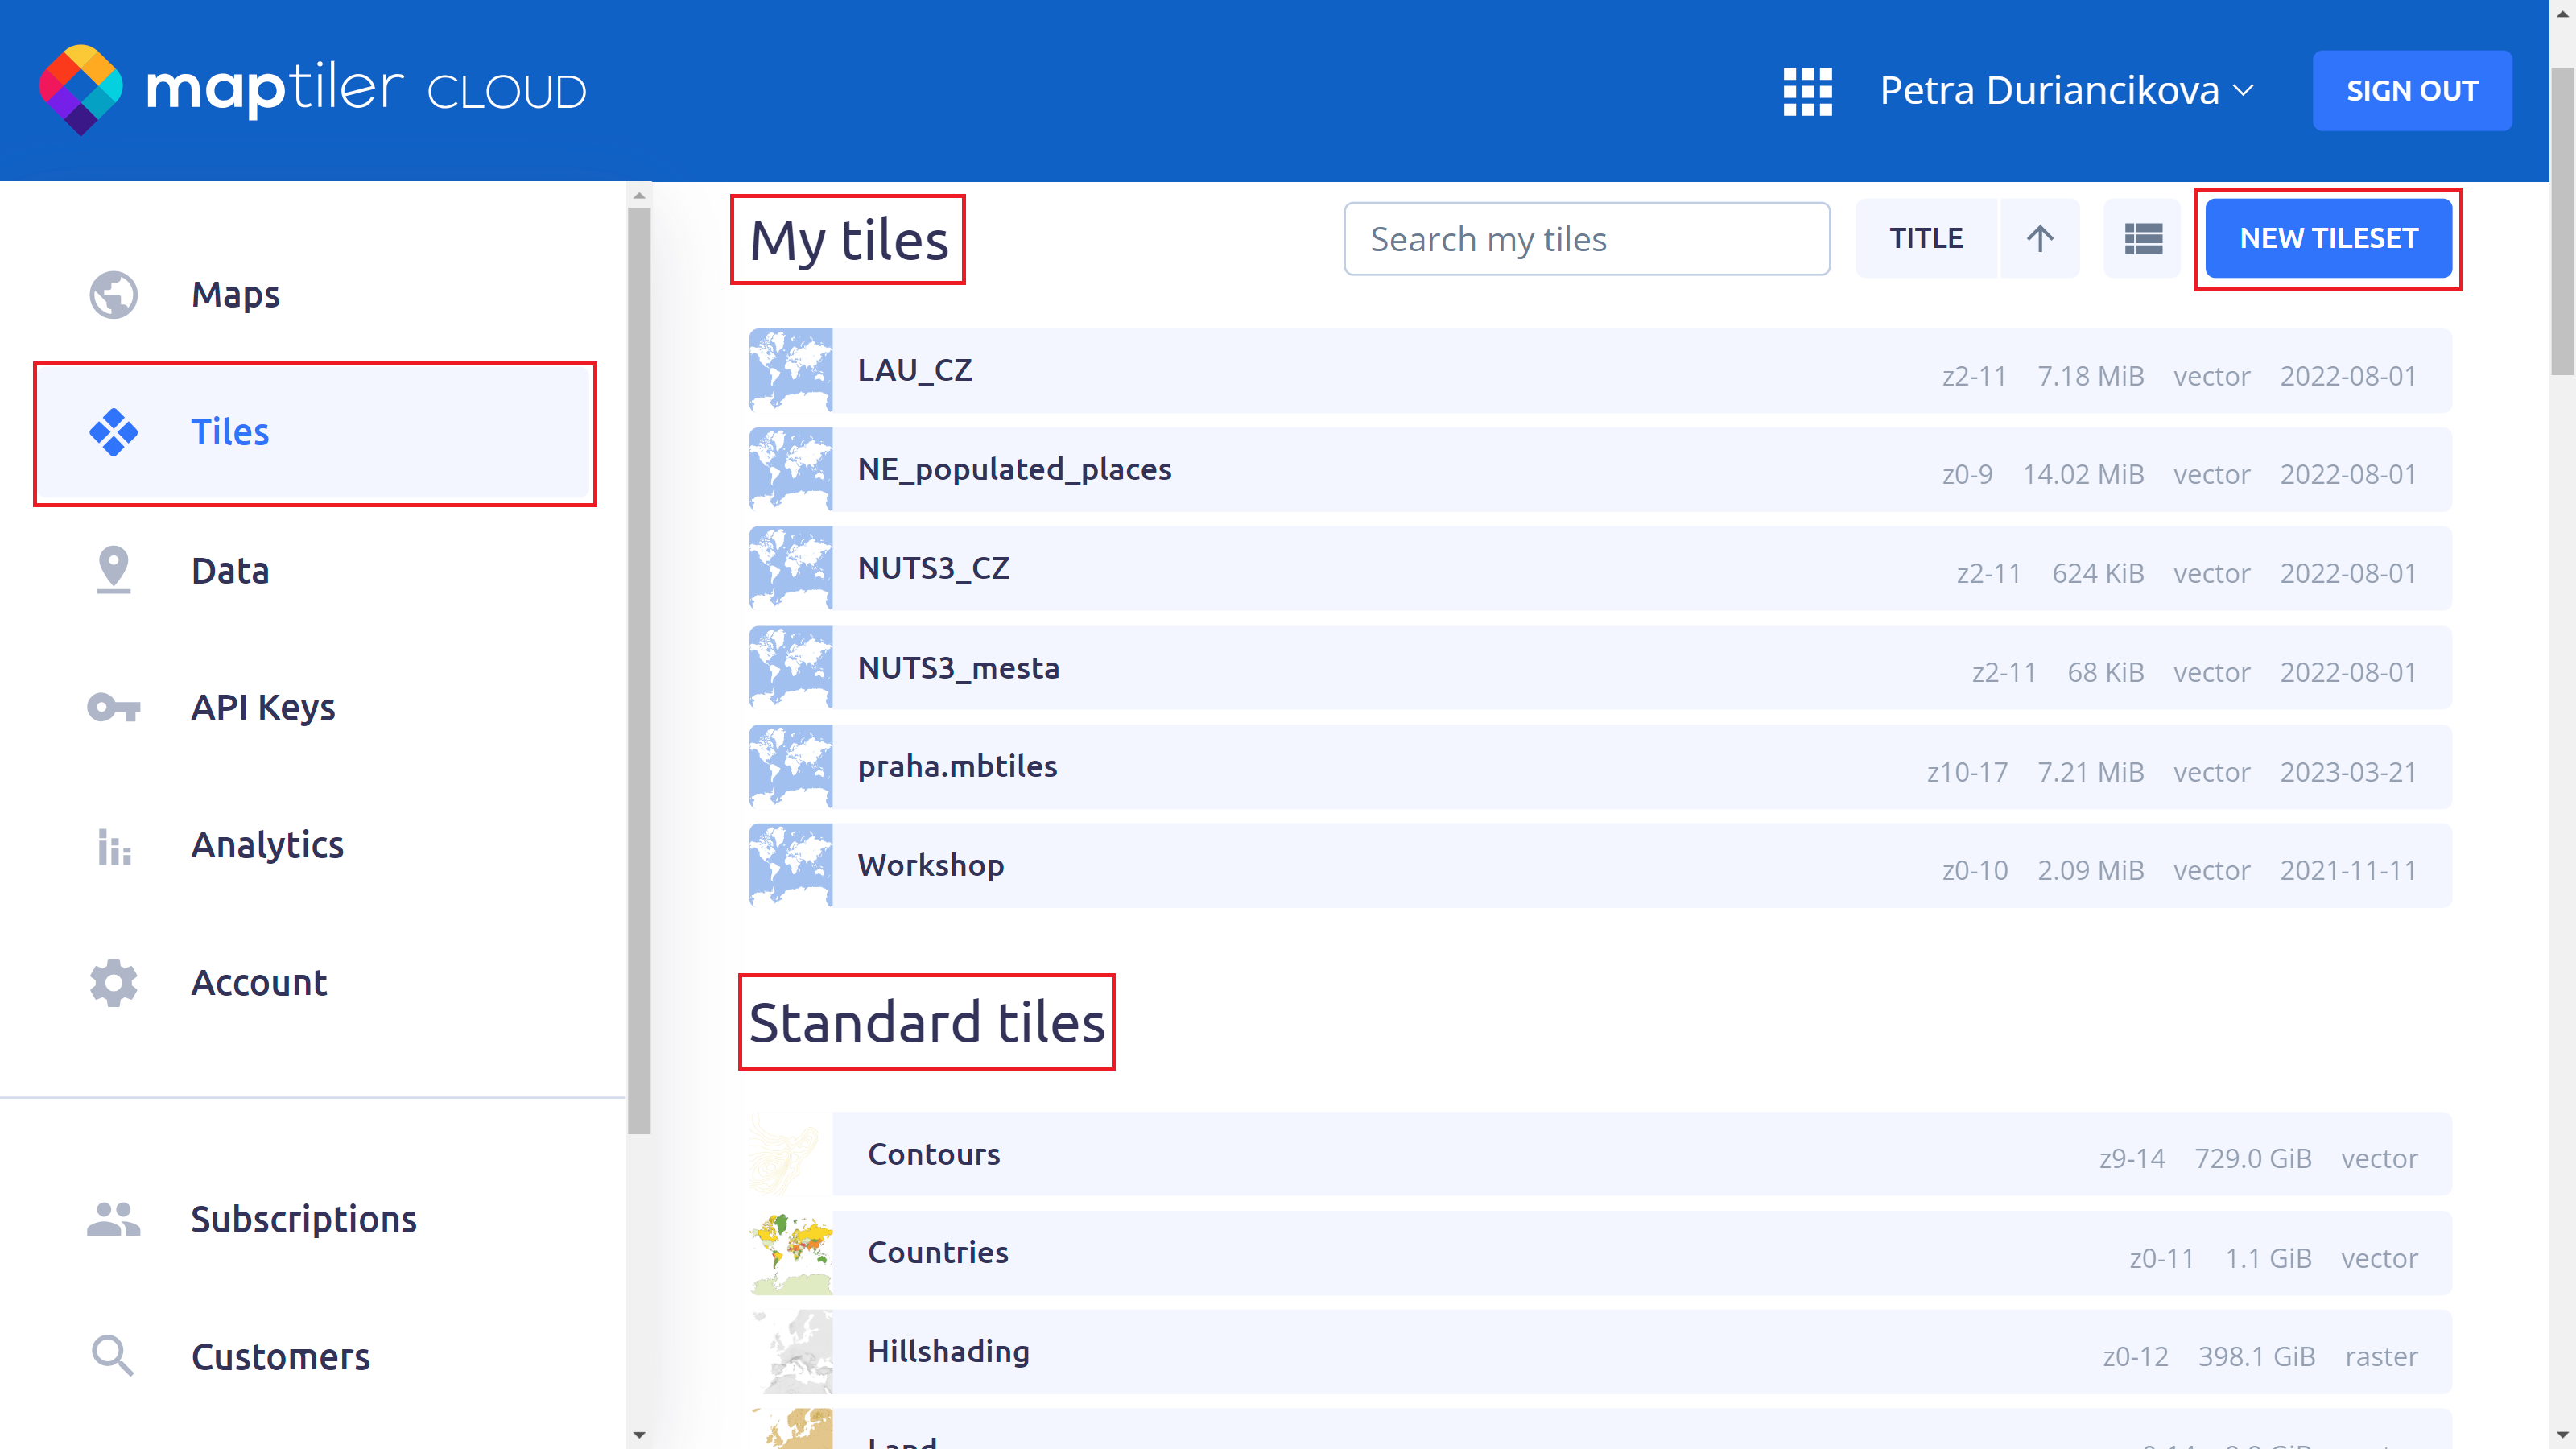
You can add either MapTiler data sources or your own. Data sources can be of two types: Tiles or Vector data file (GeoJSON). Tiles include a Standard tiles section with global data, Country specific tiles and if you add your own, you will get a My Tiles section. For upload of your own tileset, supported containers are GeoPackage or MBTiles with raster (PNG, JPG, or WebP) or vector tiles (MVT format). You can process your own data easily into tiles with MapTiler Engine software.
Vector MapTiler data sources that you can find in the Standard tiles section have their detailed schemas. From the schema, you can discover everything from layer names or fields to maps in which the data source is included.
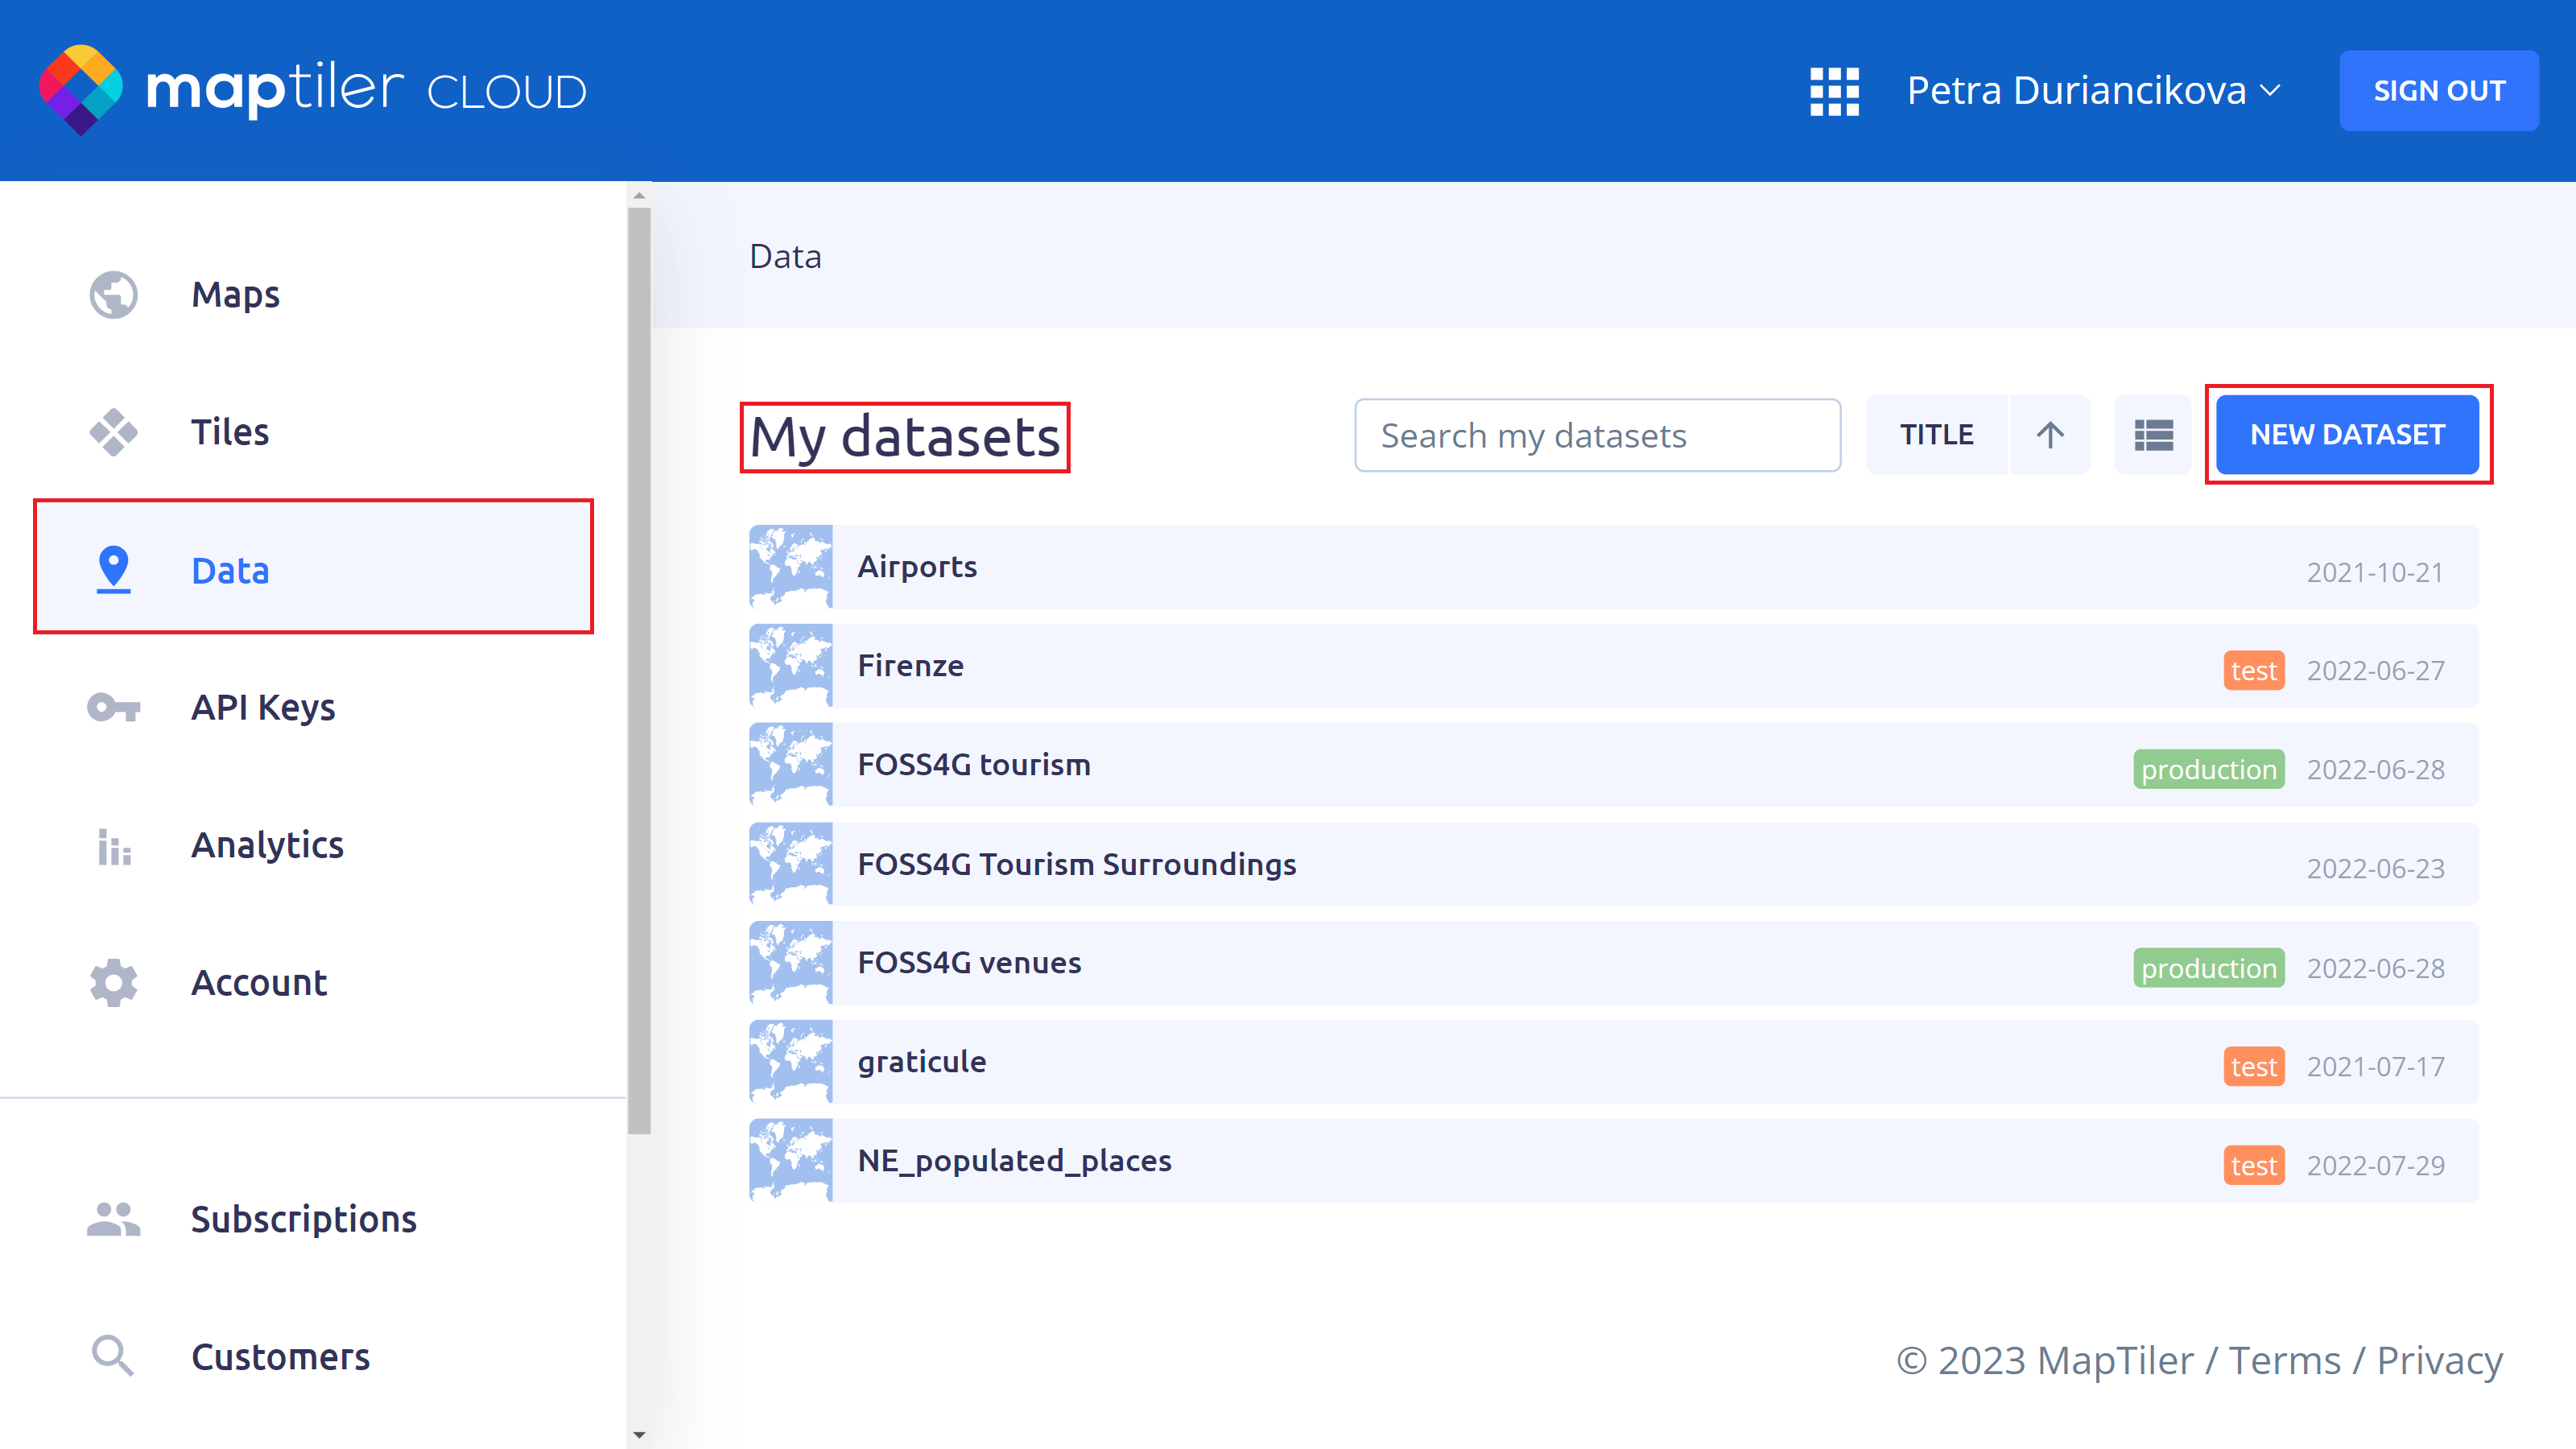
Vector data files include your own data either created from scratch in our Vector data editor or uploaded in geo formats (supported are GeoJSON, GPX, KML, and zipped SHP). The maximum allowed file size is 10 MB with 10 000 features; hence this approach is suitable for small datasets. With bigger files, we recommend tiling your data to get the best performance.
Work with data sources programmatically
As tiles are the raw data, to turn them into a map you also need information on how to style the data. Tiles are useful where you want to combine elements of different datasets into one map.
MapTiler Tiles API offers several standard tilesets for everyone to use in their maps, such as MapTiler Planet, OpenMapTiles, Countries, Contours, Terrain, Satellite, etc. You can also upload your own.
Live example: MapTiler Planet tileset
To add a tileset in a vector tile custom style, add a new data source in the sources section of the JSON style and write the URL of the tileset in the url property.
Example: JSON style fragment with two tilesets
{
..........
  "sources": {
    "satellite": {
      "url": "https://api.maptiler.com/tiles/satellite-v2/tiles.json?key={{site.maps.docs-key}}",
      "tileSize": 512,
      "type": "raster"
    },
    "openmaptiles": {
      "url": "https://api.maptiler.com/tiles/v4/tiles.json?key={{site.maps.docs-key}}",
      "type": "vector"
    }
  }
.........
}
Work with data sources in Map Designer
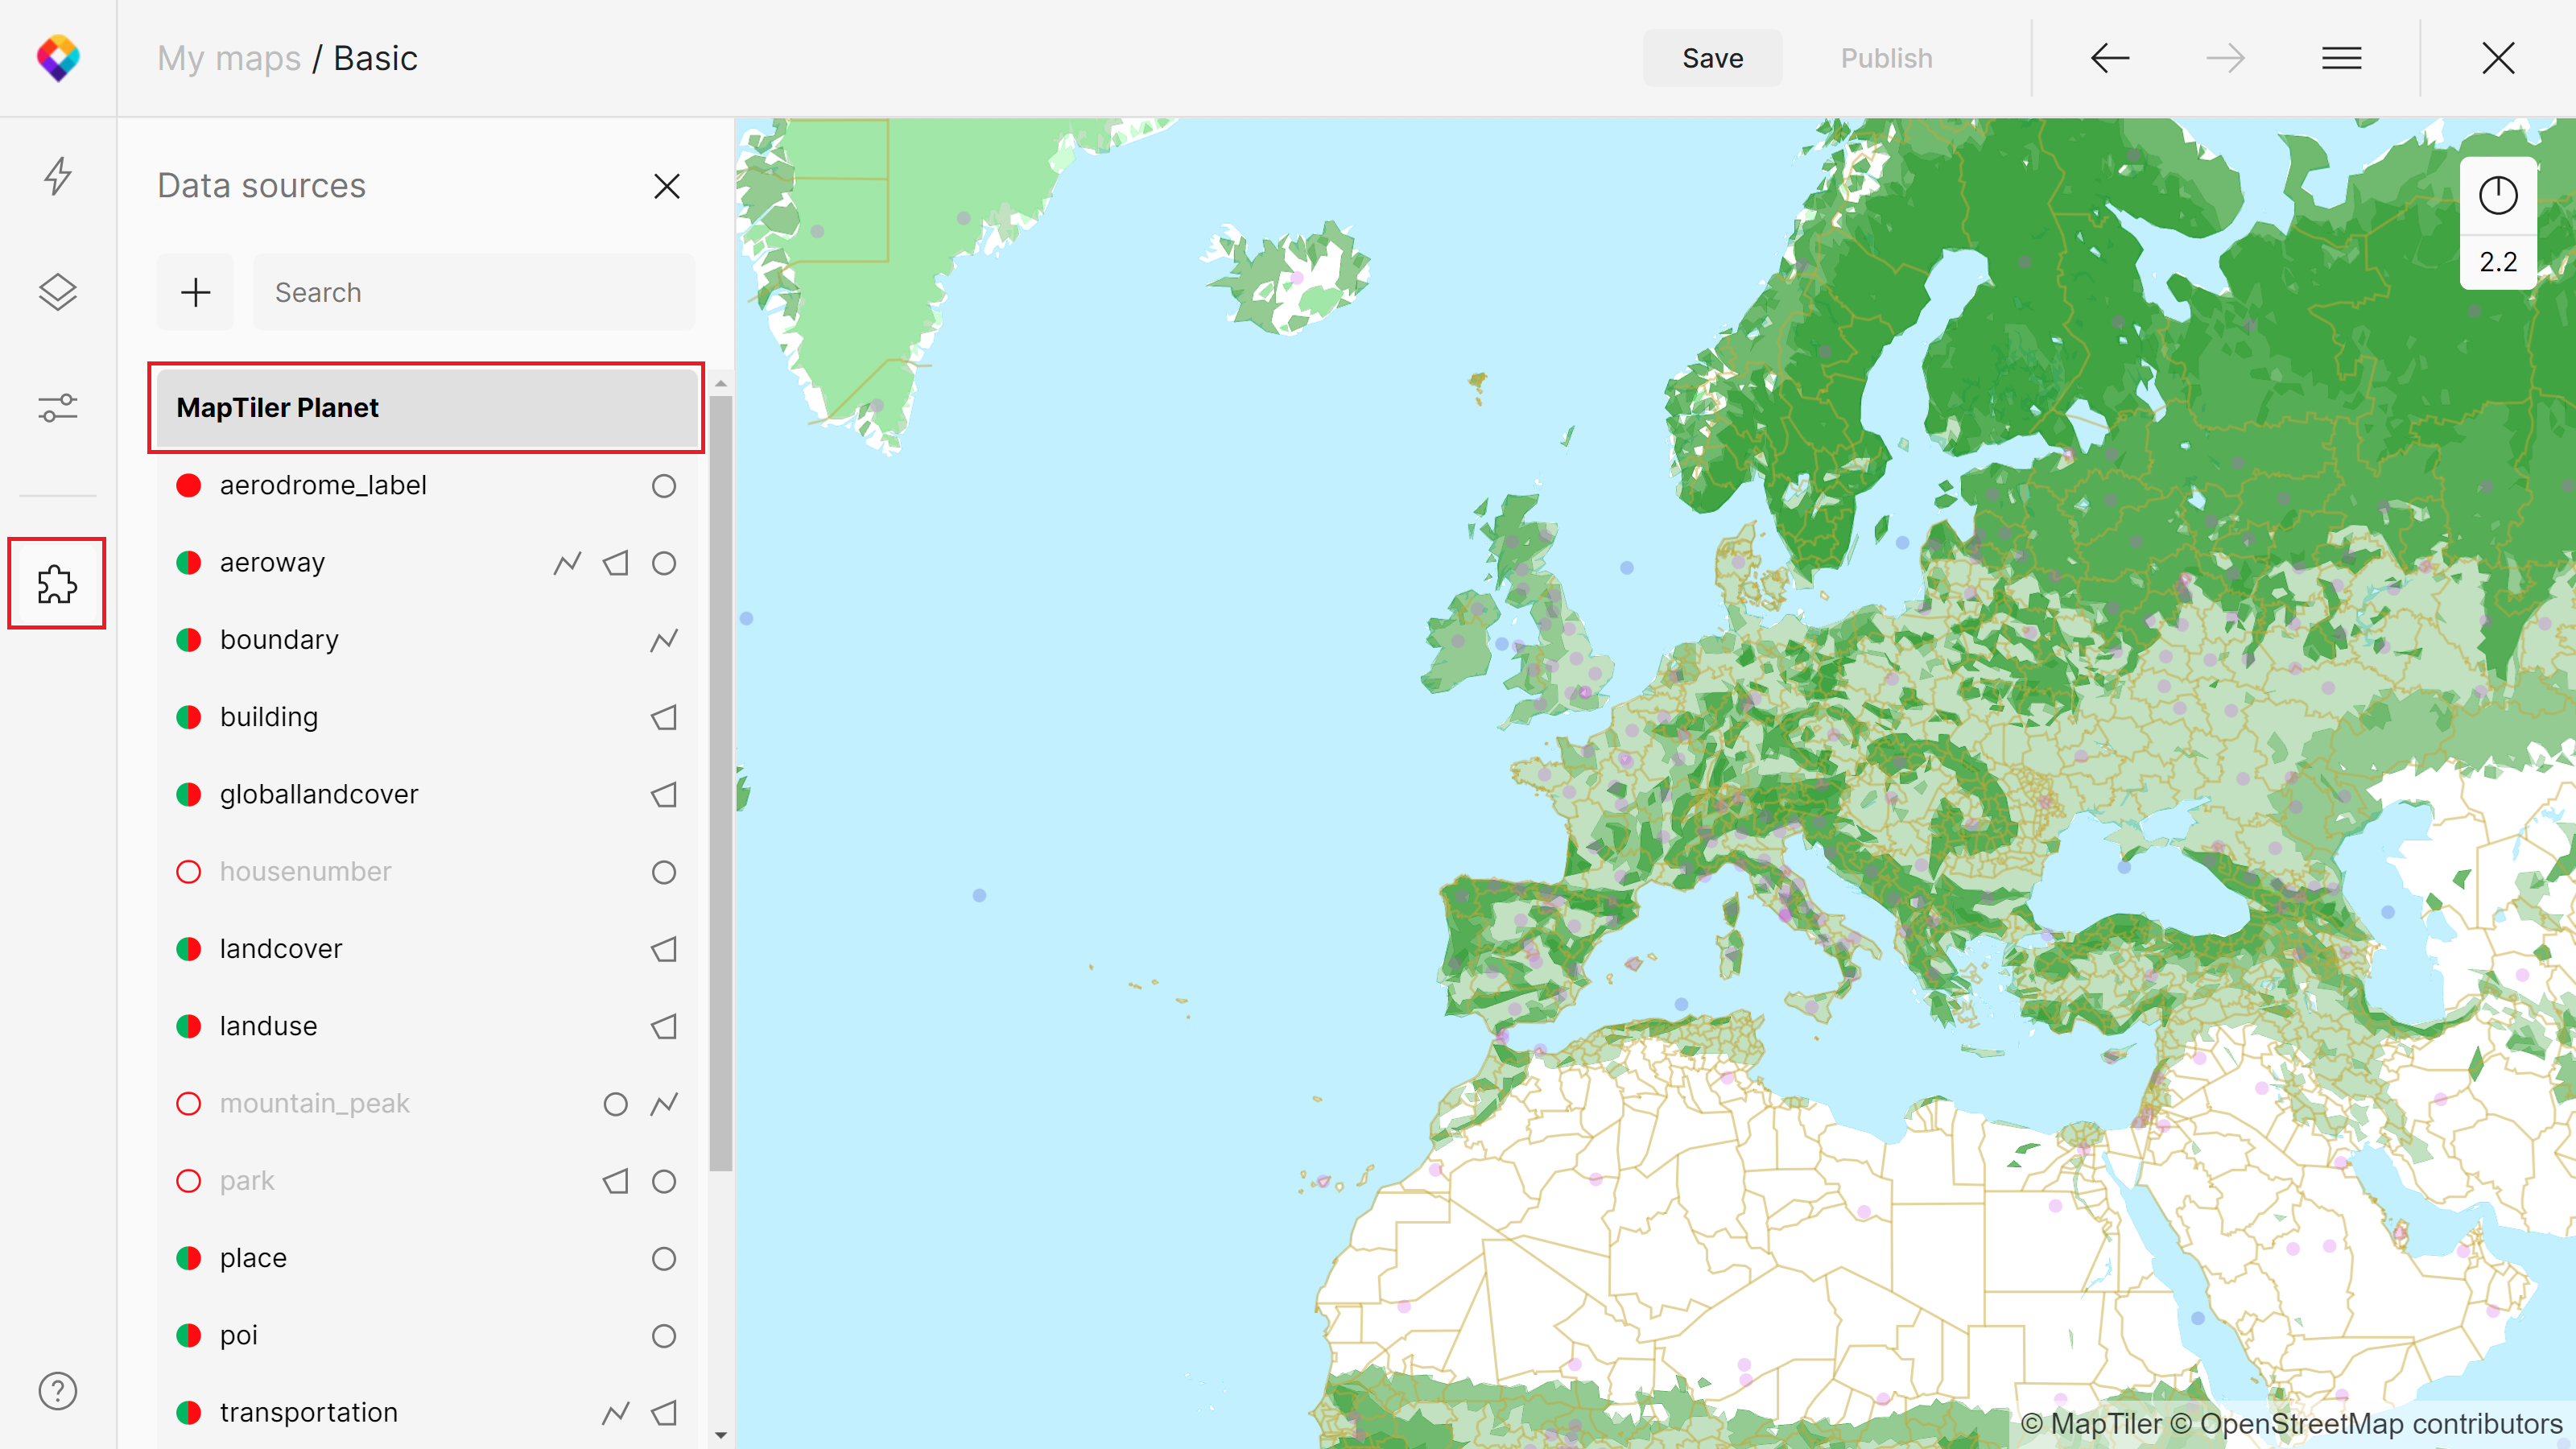
In MapTiler Map Designer, you can manipulate the data sources from the Data sources panel (puzzle icon or Alt+D). You will find all data sources used in your map there, including the data layers. If a layer is not used in your map but is available, it will be greyed out.
In the example below, we have a MapTiler Planet data source with layers such as “aerodrome_label”, “boundary”, “landcover”, etc. “Housenumber” or “mountain_peak” layers are available but not used in our map.
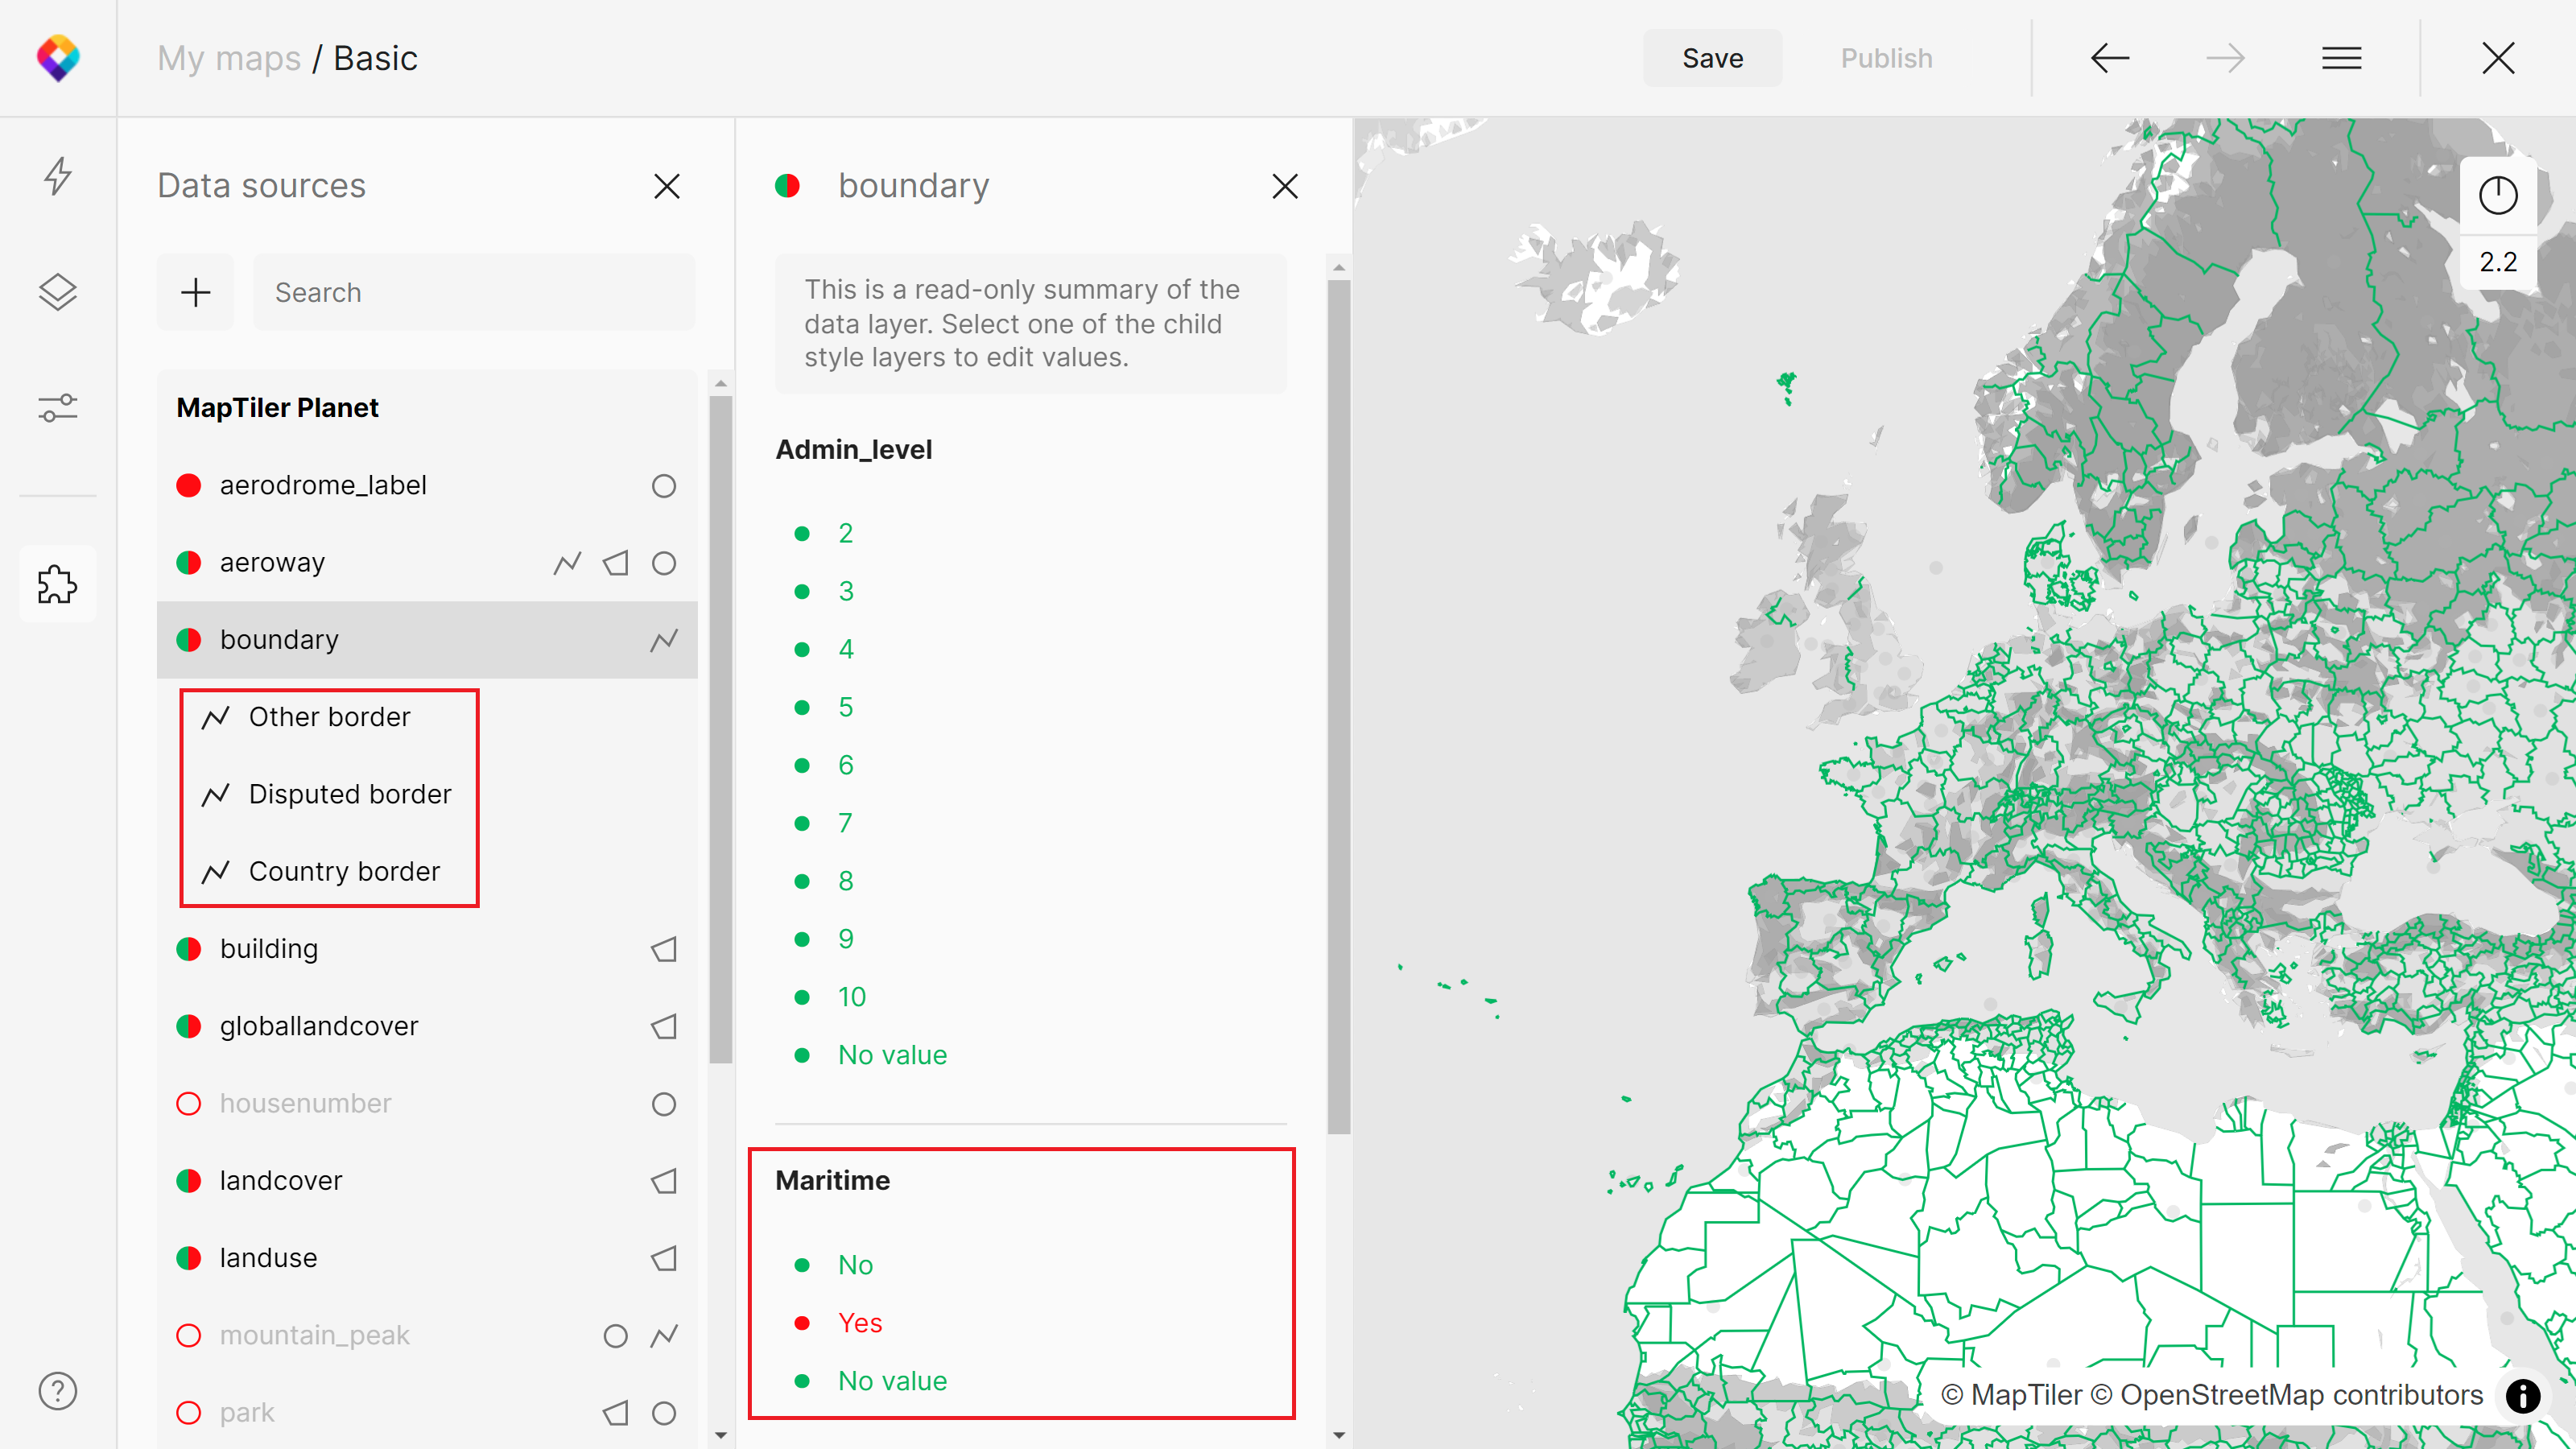
After clicking on a specific data layer, MapTiler Map Designer will tell you what map style layers it is included in, what attributes it has, and what you have filtered in the map.
In our case, map style layers “Other border”, “Disputed border” and “Country border” use data from the “boundary” layer. You can also see that in the map we don’t use maritime boundaries (Maritime=Yes is not selected in the filter).
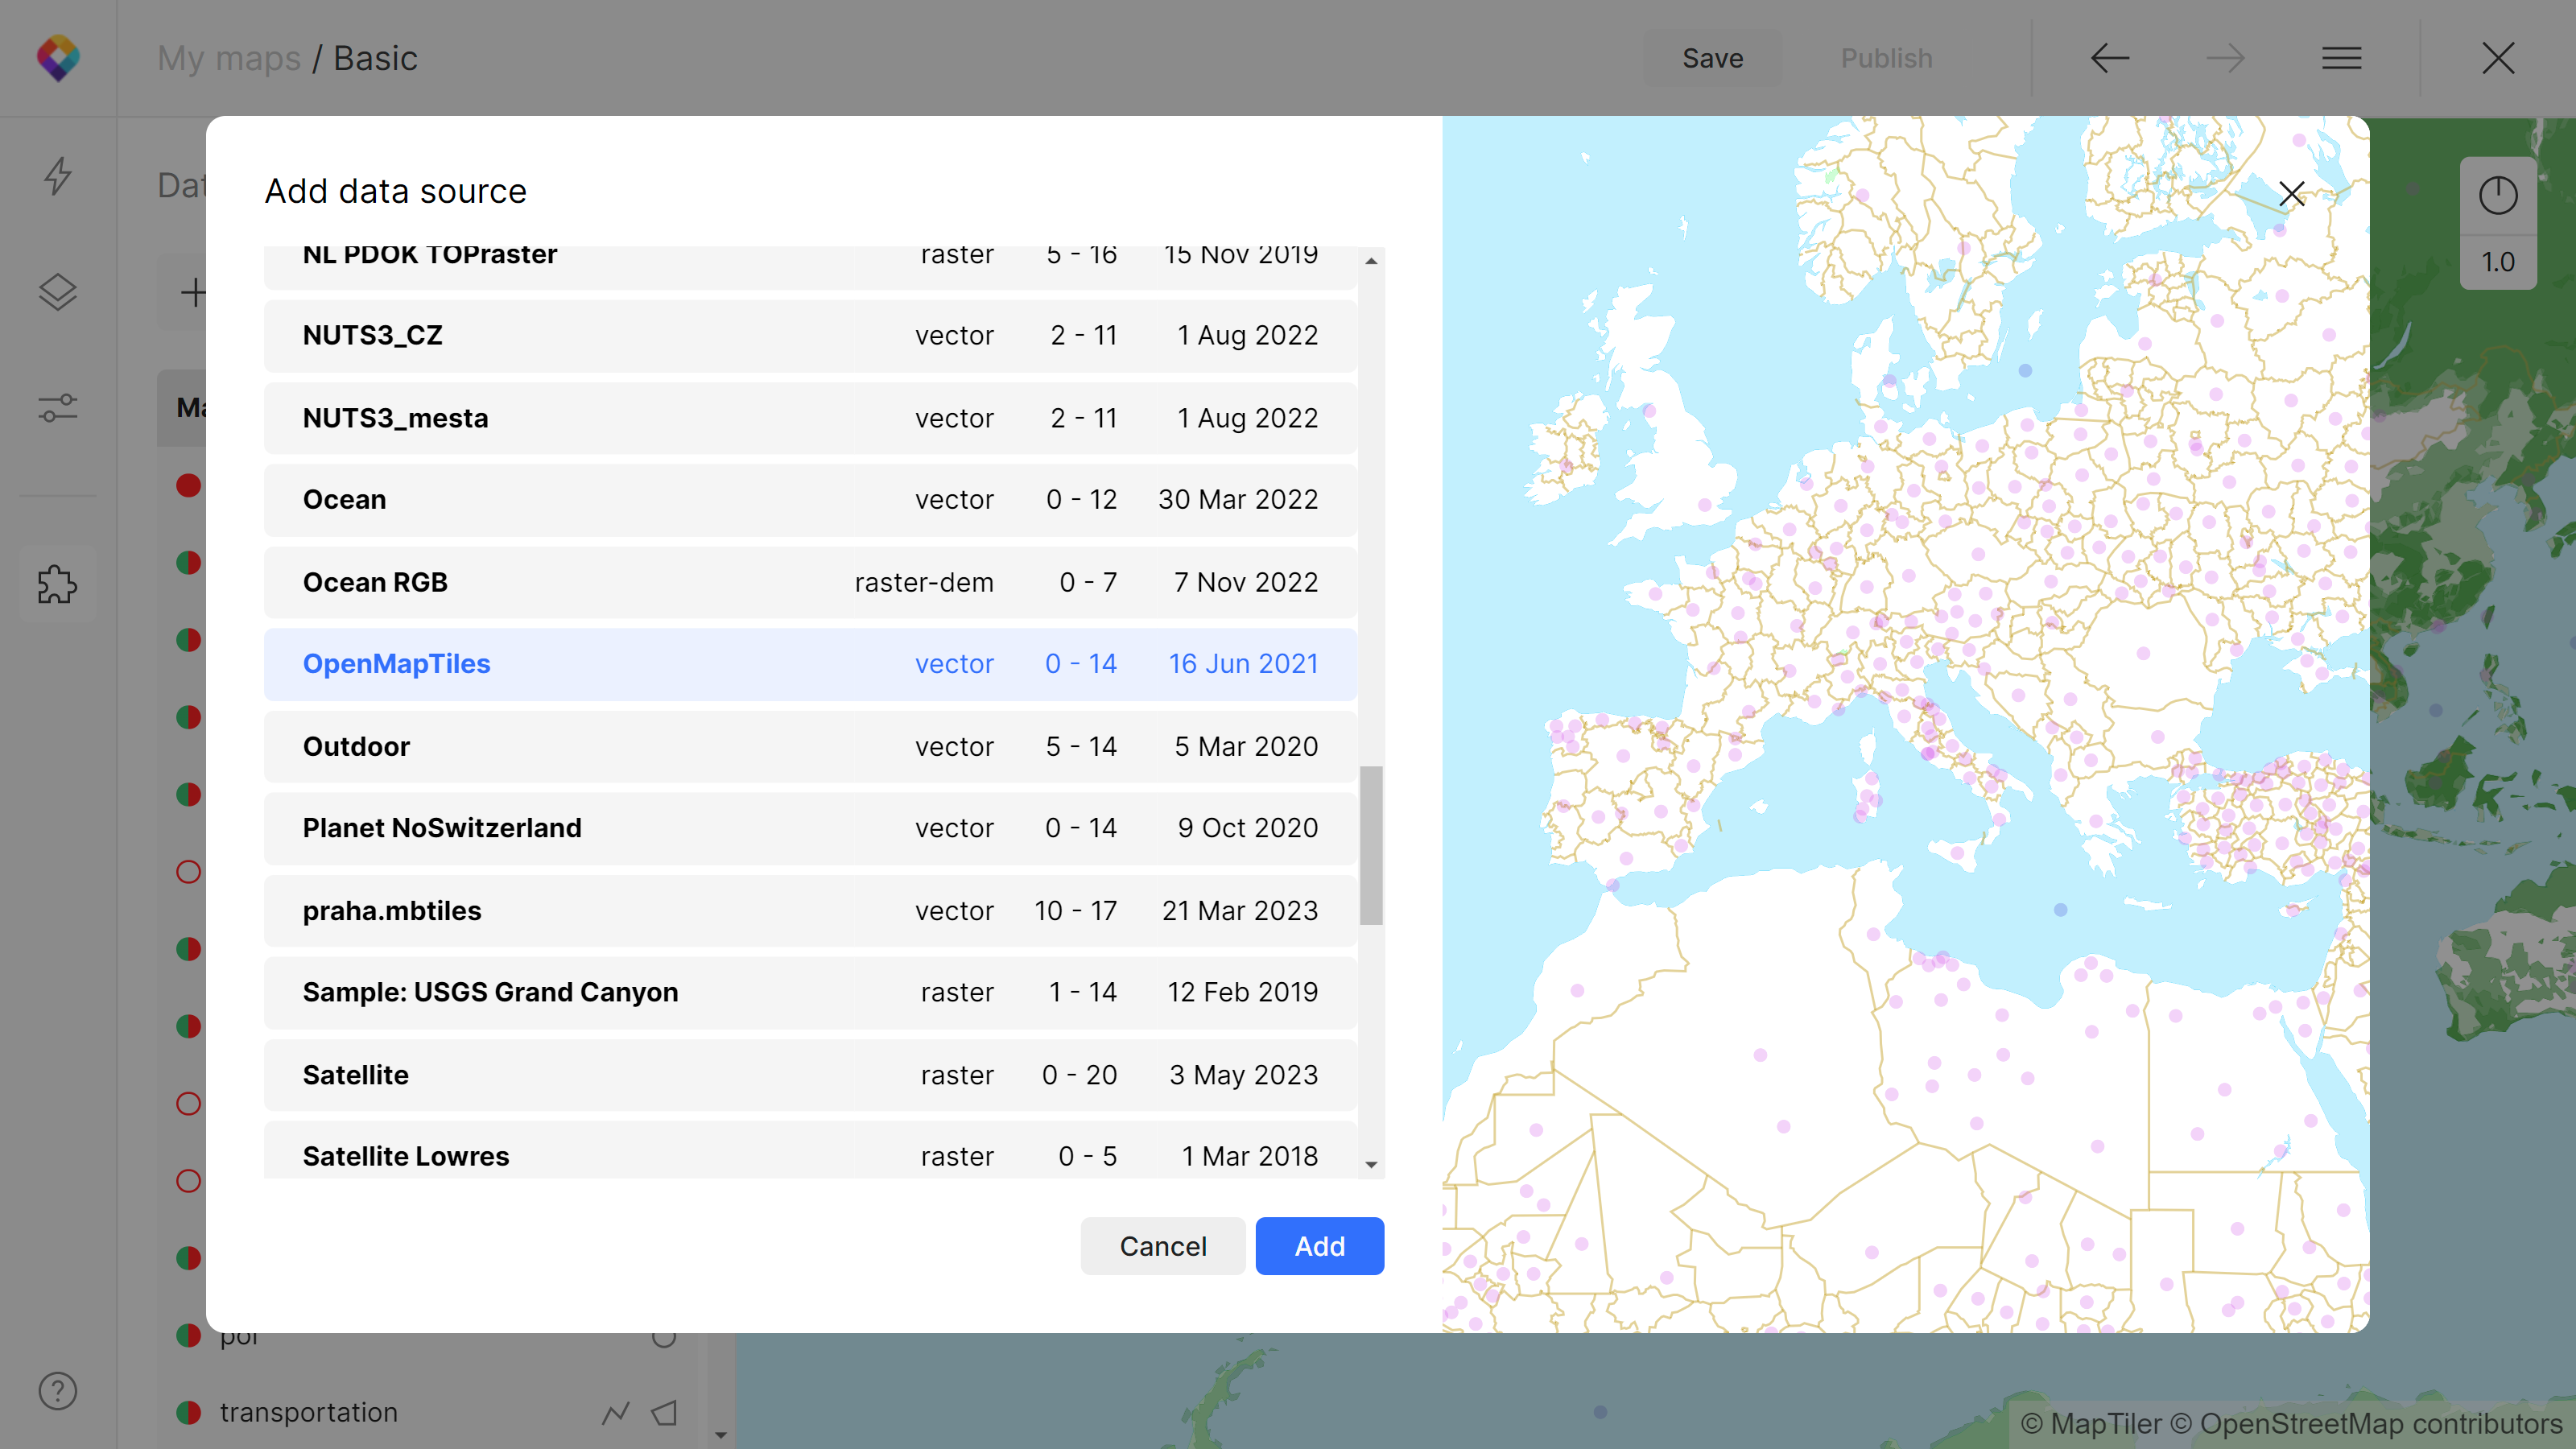
Add a new data source
Adding a data source is easy; just use the “plus” button next to the search. In the dialogue window, you will see all available data sources with information (type, zoom, and date of creation) including your own uploaded data. When selecting your preferred data source, there is an overview map on the right which you can zoom in to explore the data thoroughly.
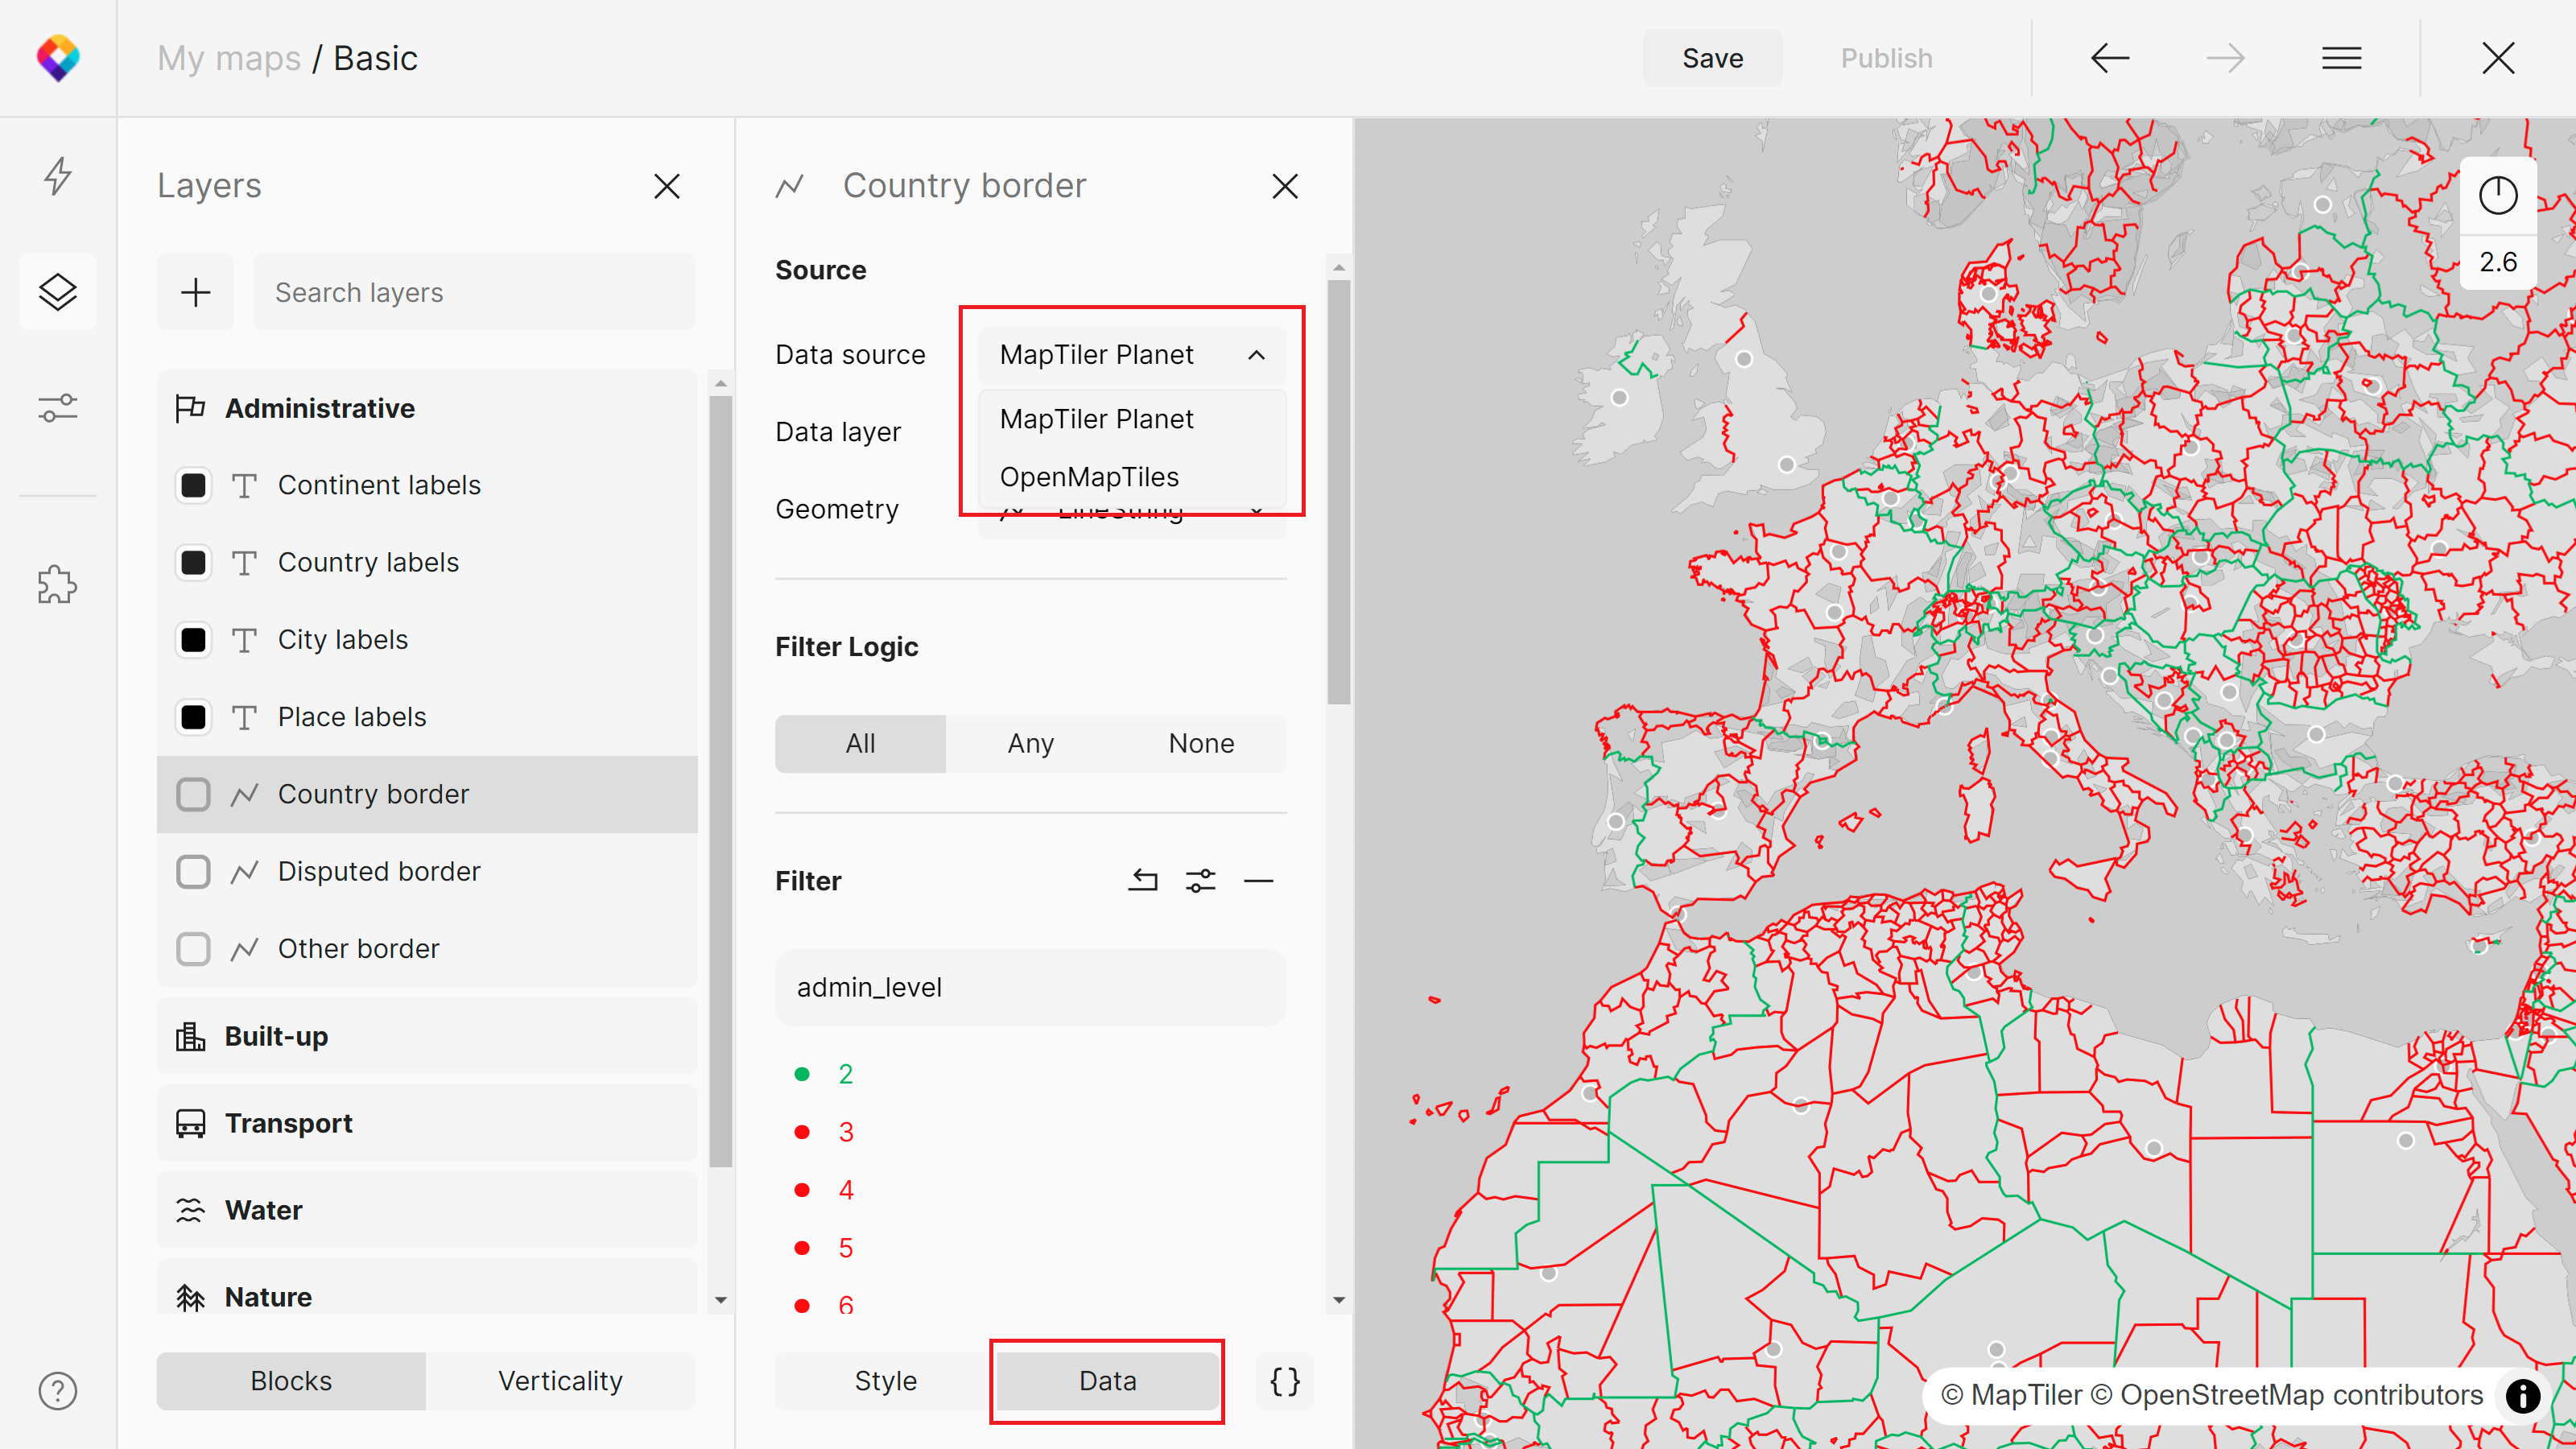
Once you have the data source added, you can go to the Layers panel (Alt+L) and include it in your style layers. It will appear as an option in a Source drop-down menu in the Data panel. However, be aware that raster sources can be chosen only for raster layers and vectors for vector layers.
Add a style layer
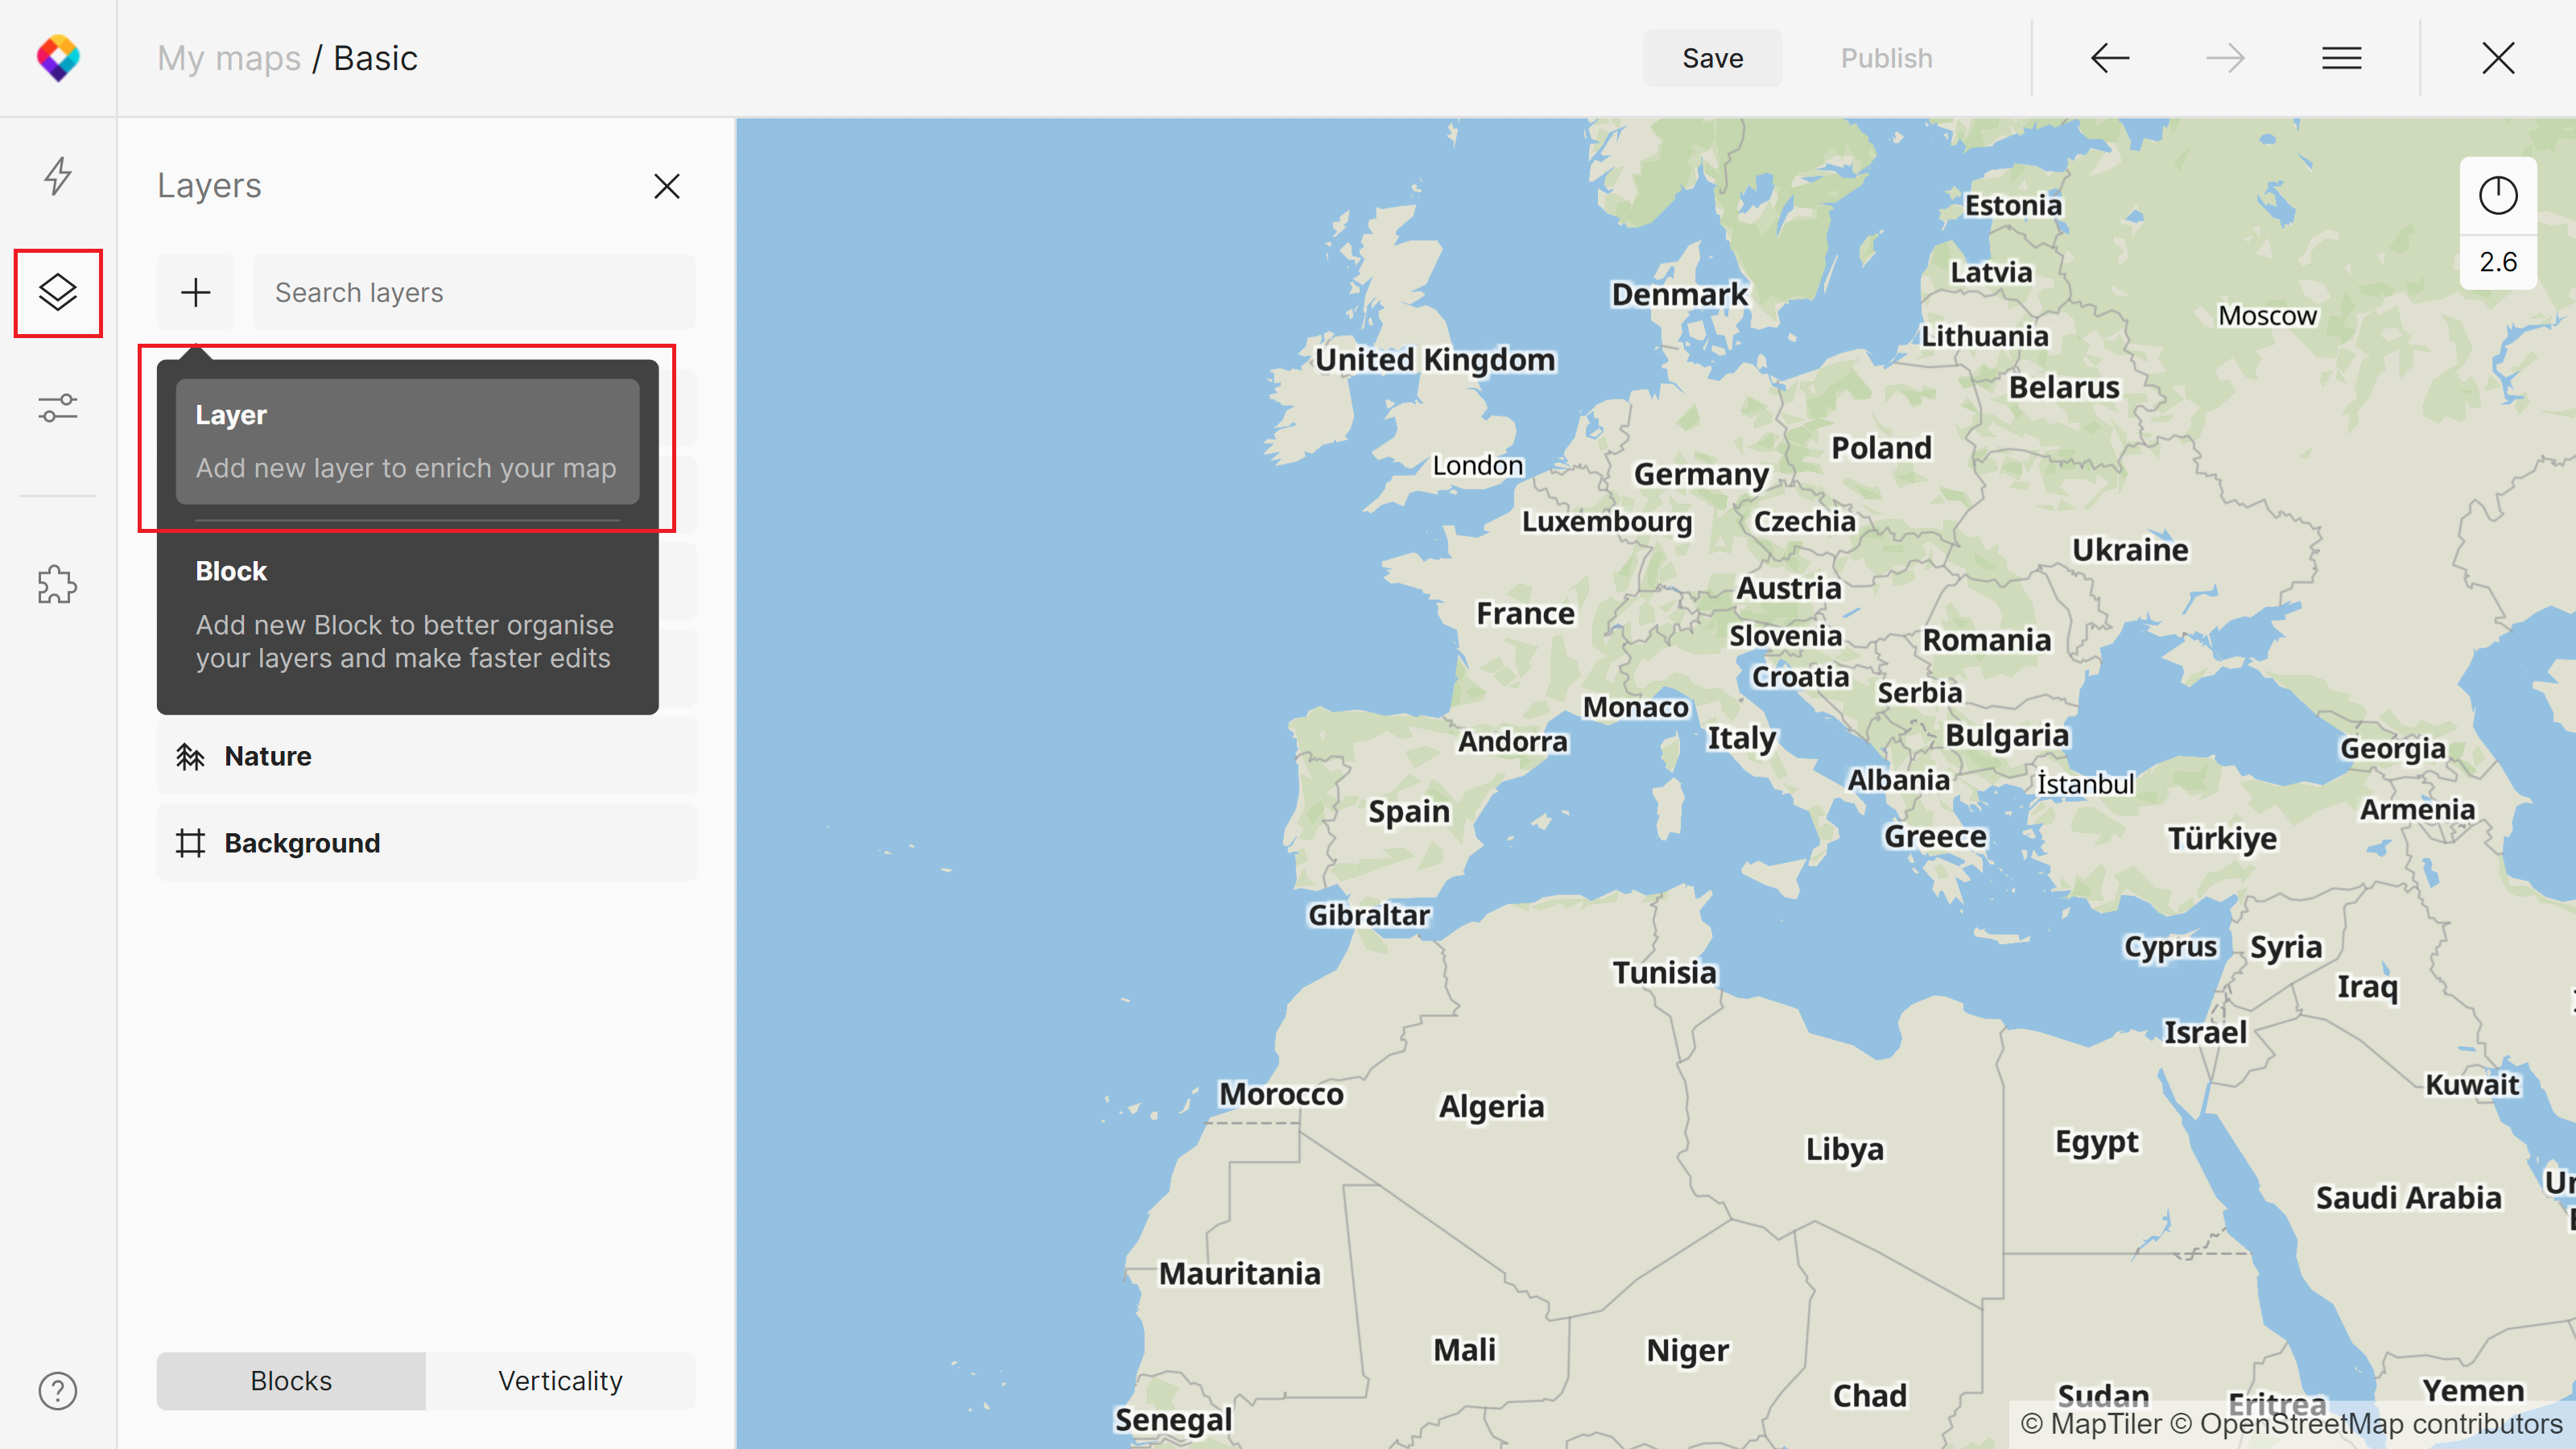
A data source can also be added directly as a new style layer. Go to the Layers panel > “plus” button > Add a new layer to enrich your map.
In the case of rasters, you will choose your layer, geometry, and how it should be included in the map (Parent block, Visualization, Layer name) and you can style it right away.
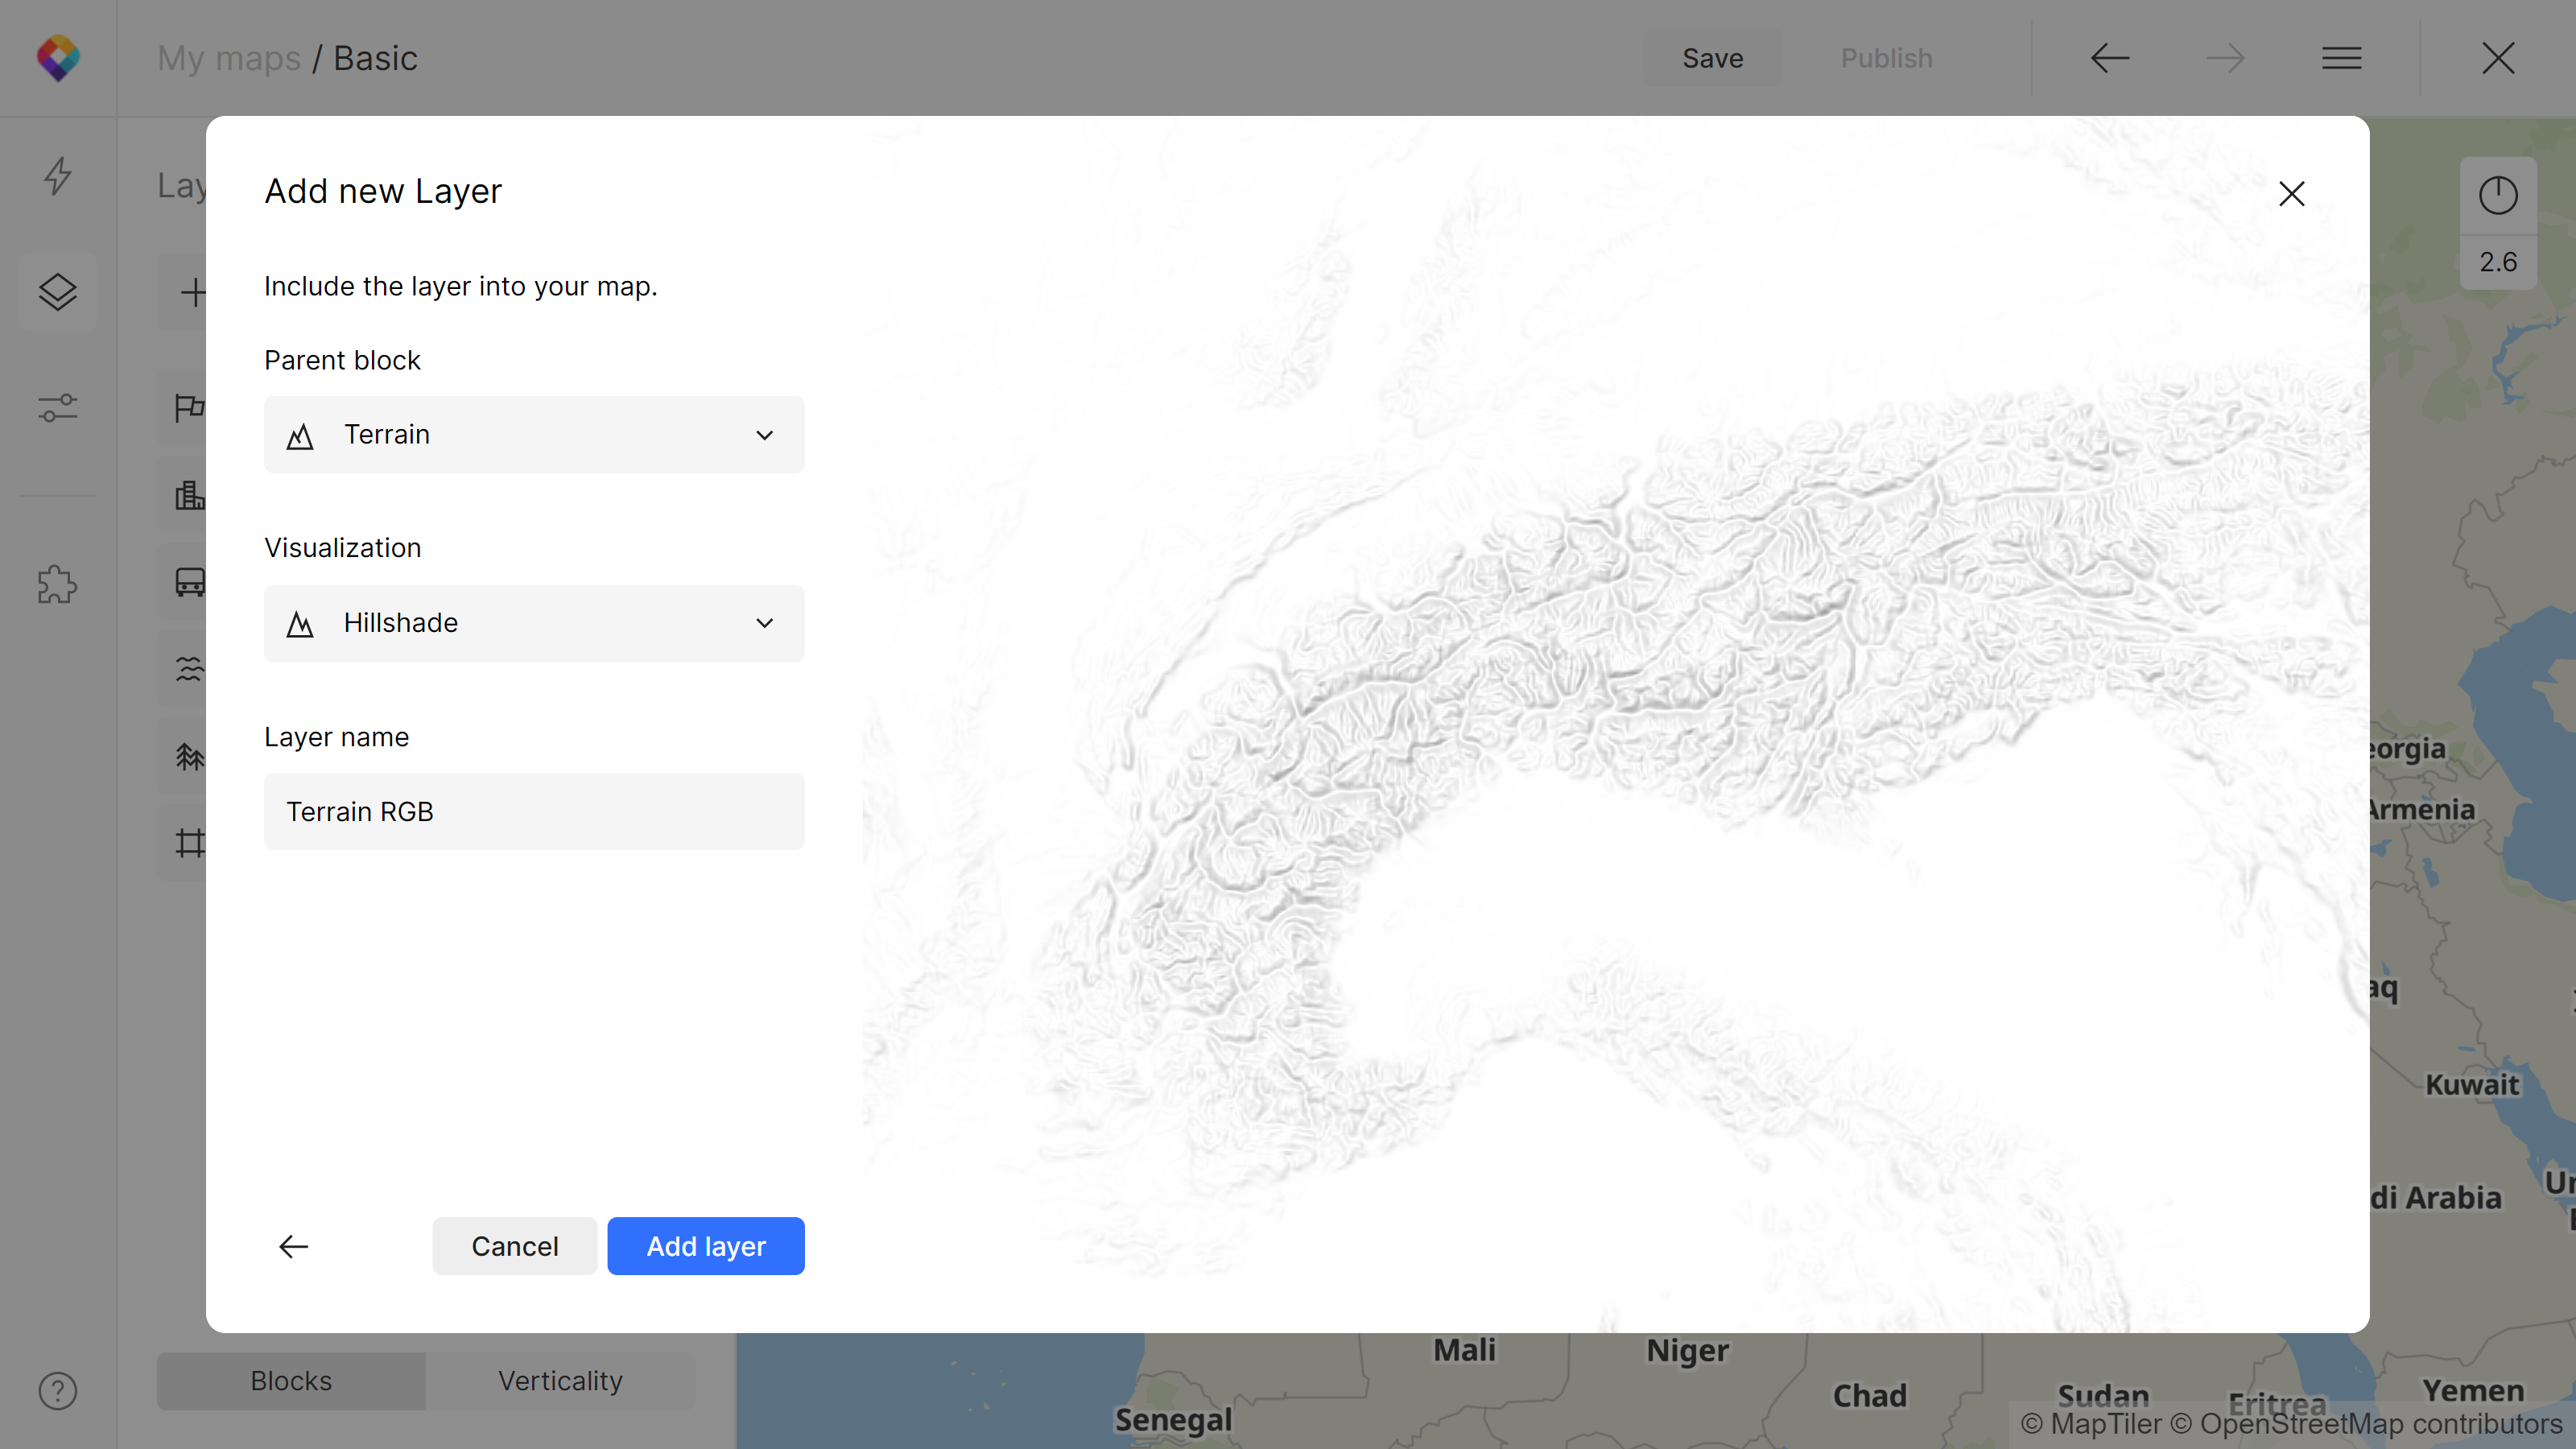
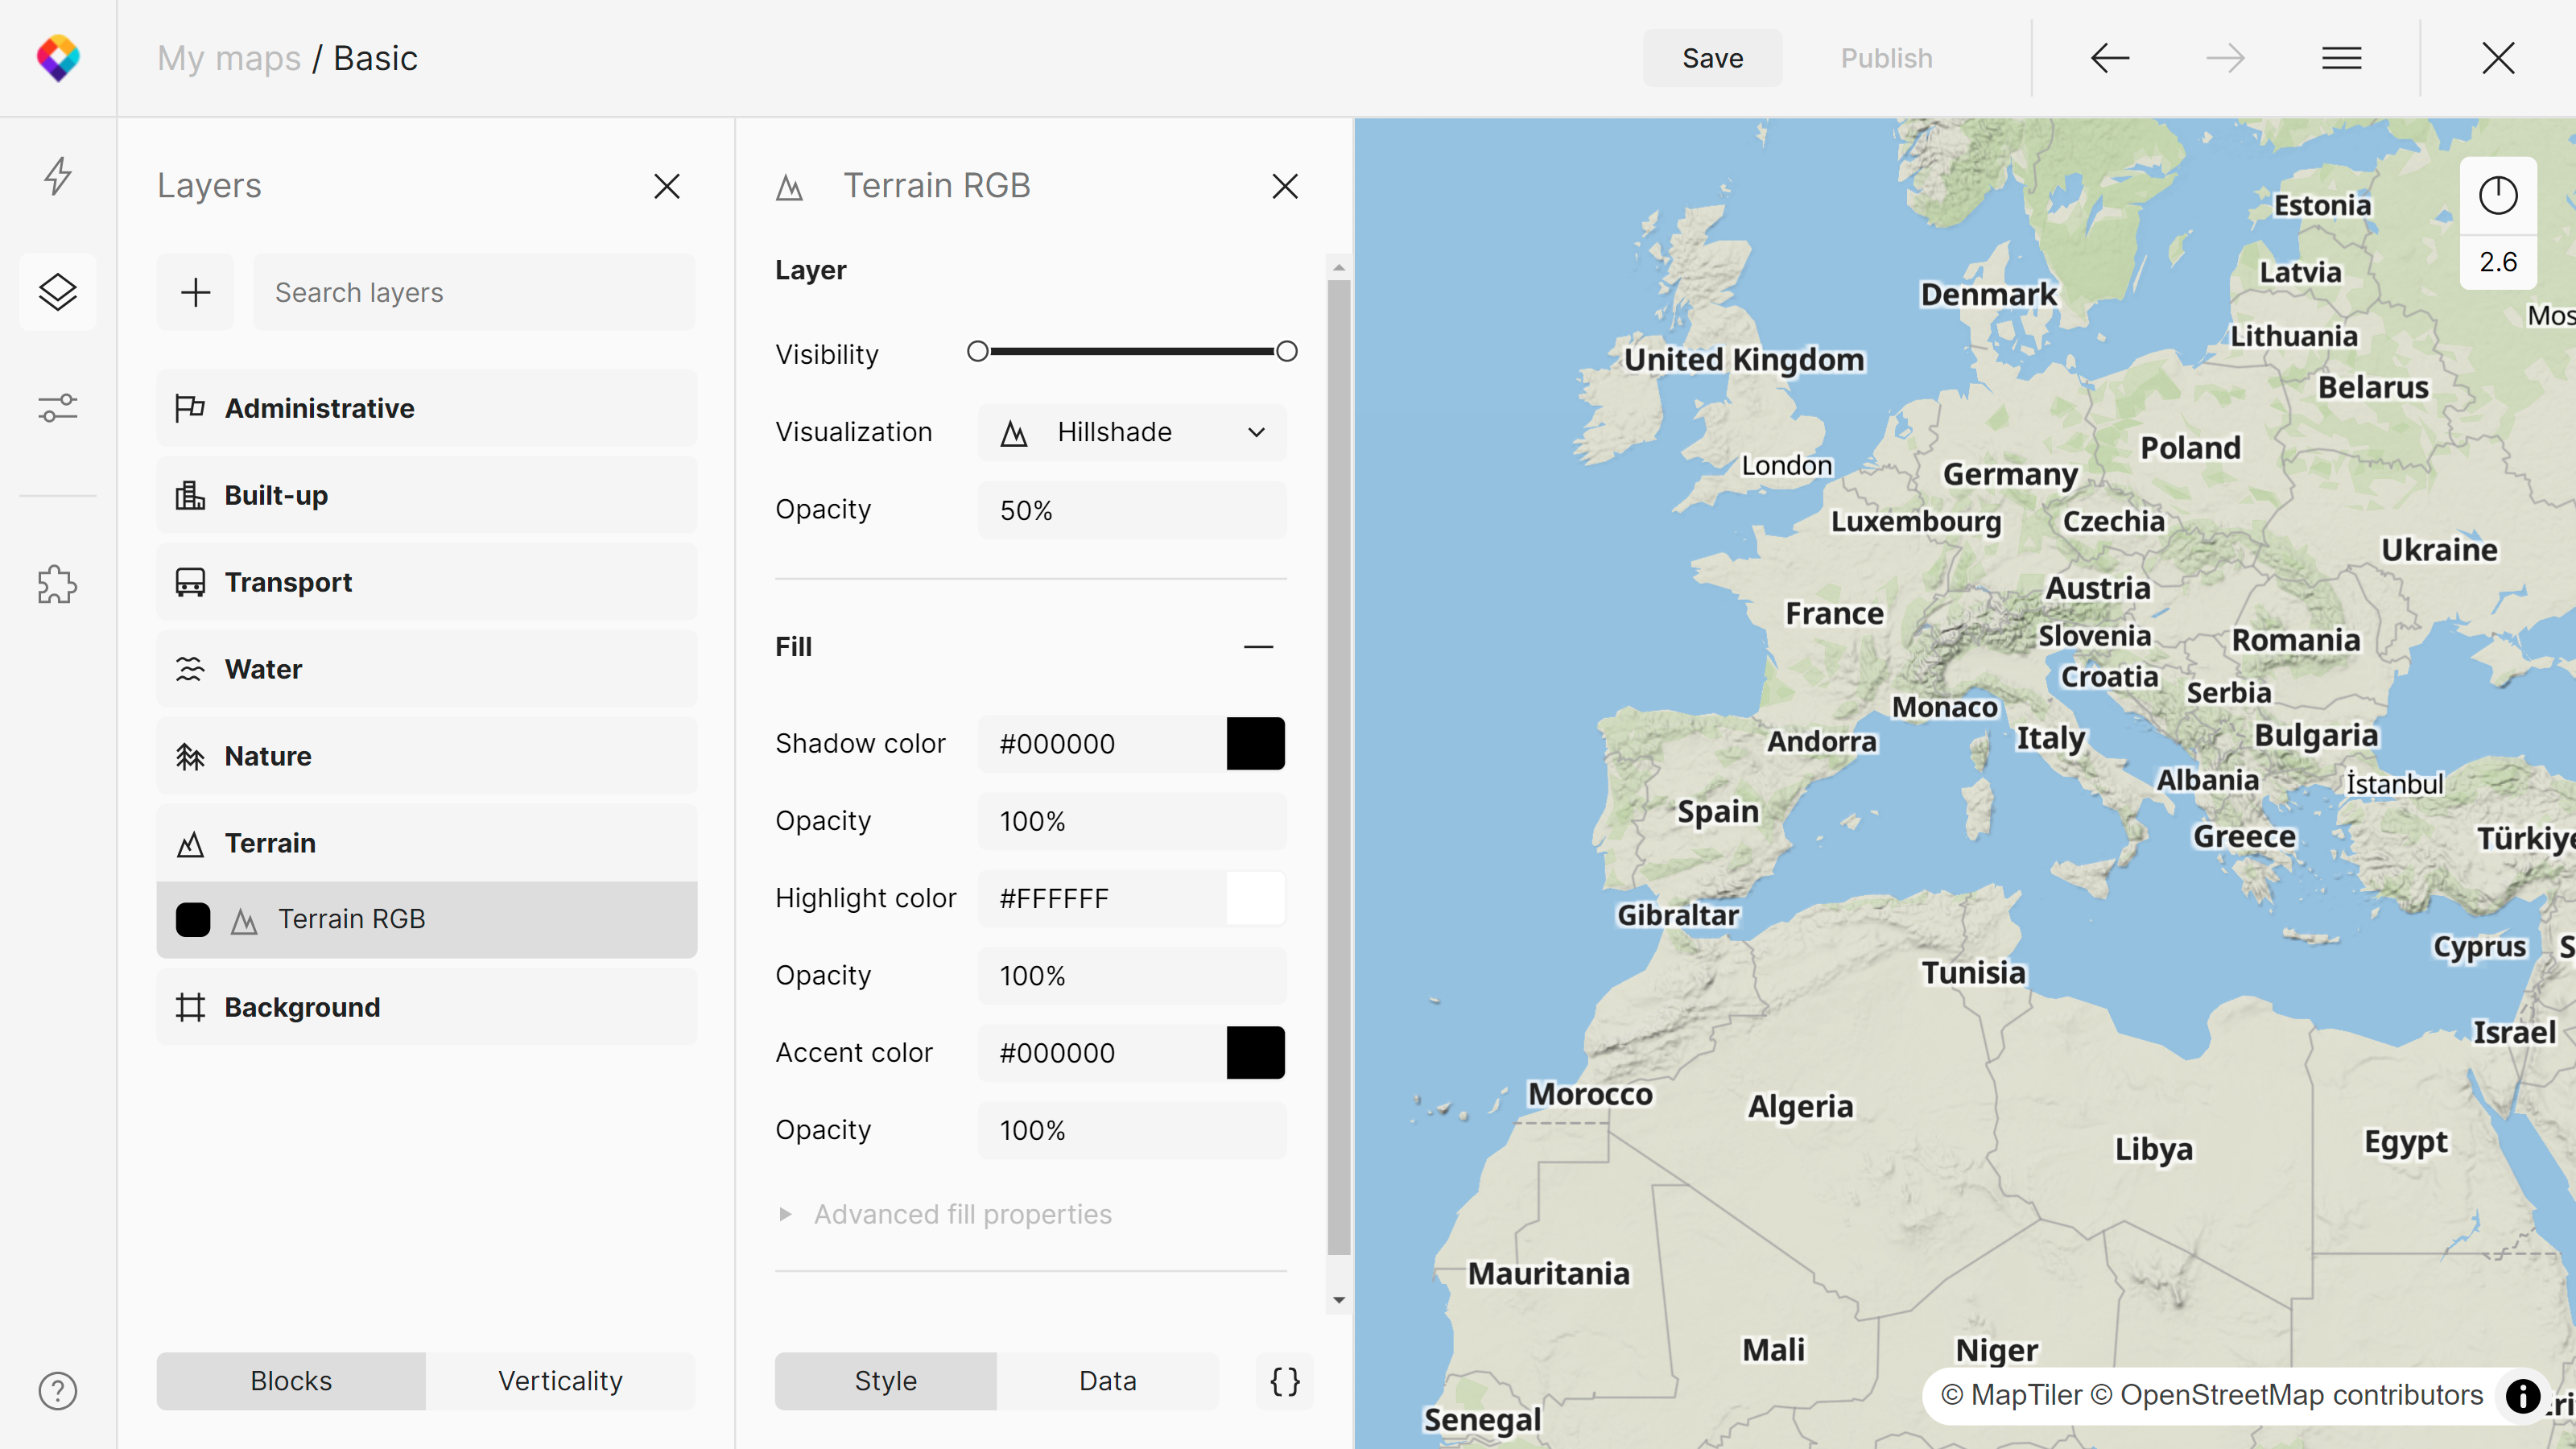
In this example, we are adding Terrain RGB into the Terrain block as a Hillshade. Below you can see how the map looks with the Terrain included.
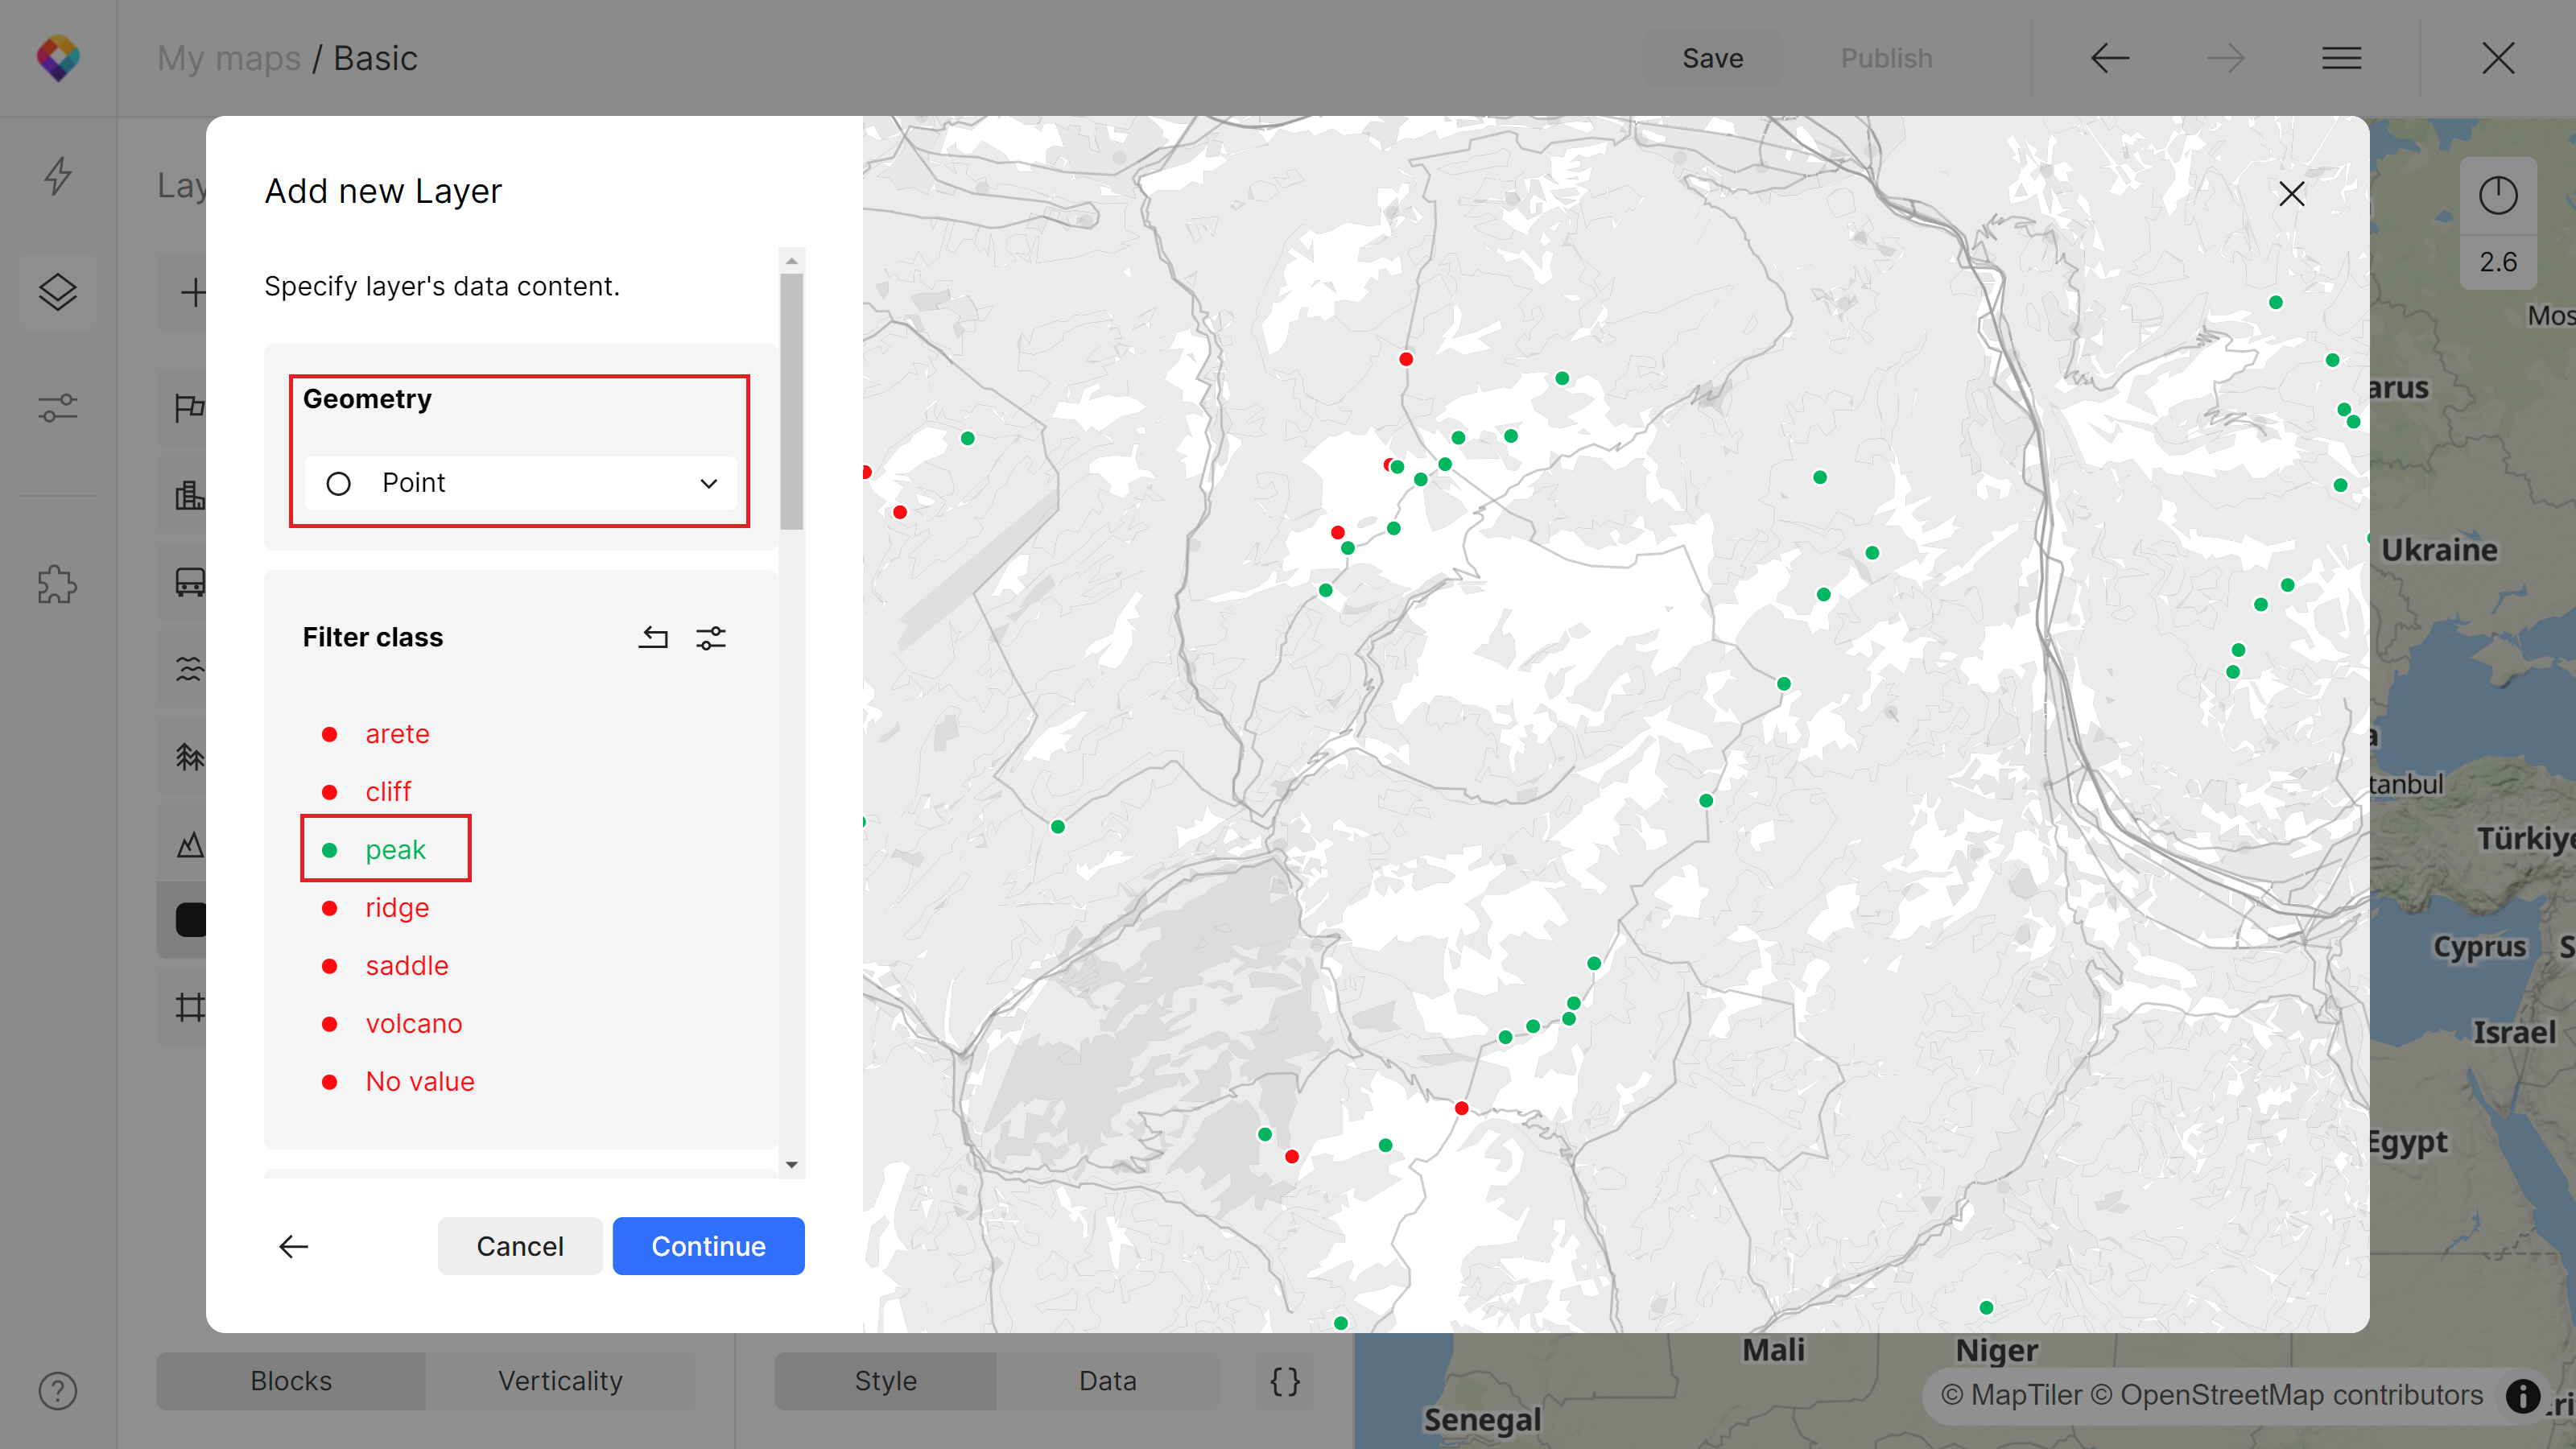
In the case of vectors, apart from choosing a geometry, you will be asked to look at filters before adding a layer to your map. This way, you can choose to include only specific classes, names, or other values. As an example, we are adding mountain peaks to our map.
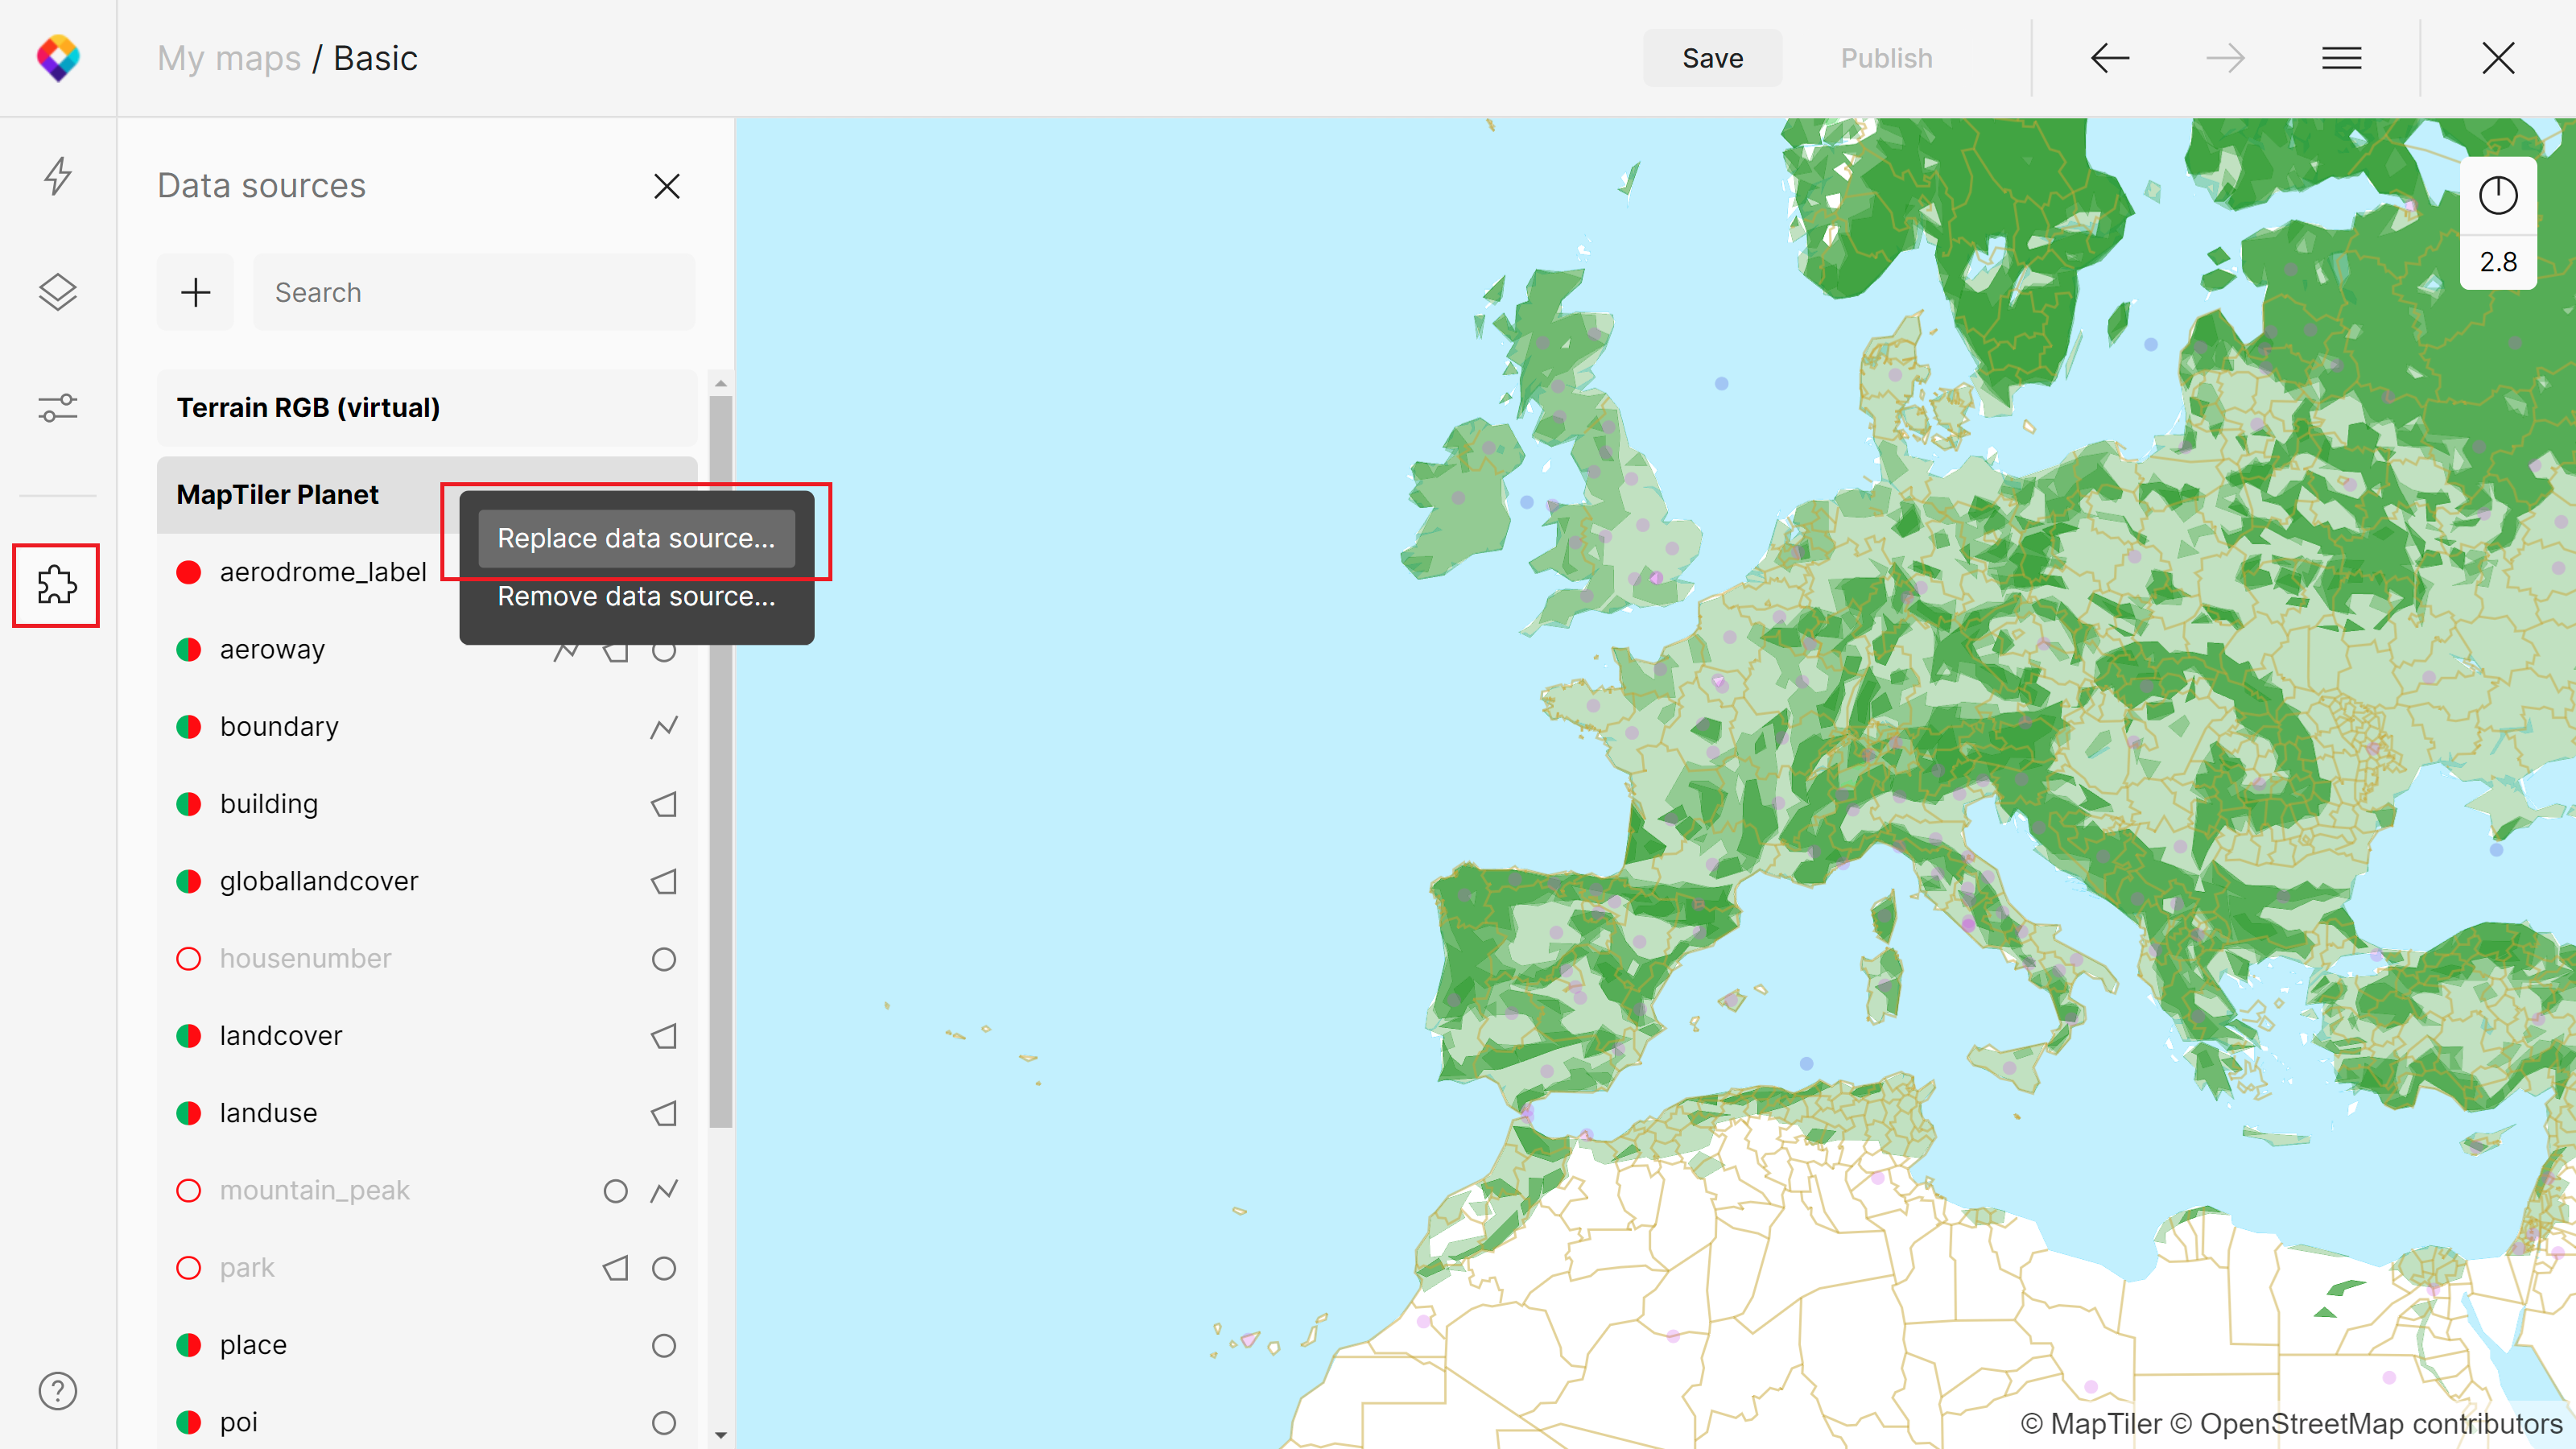
Replace a data source
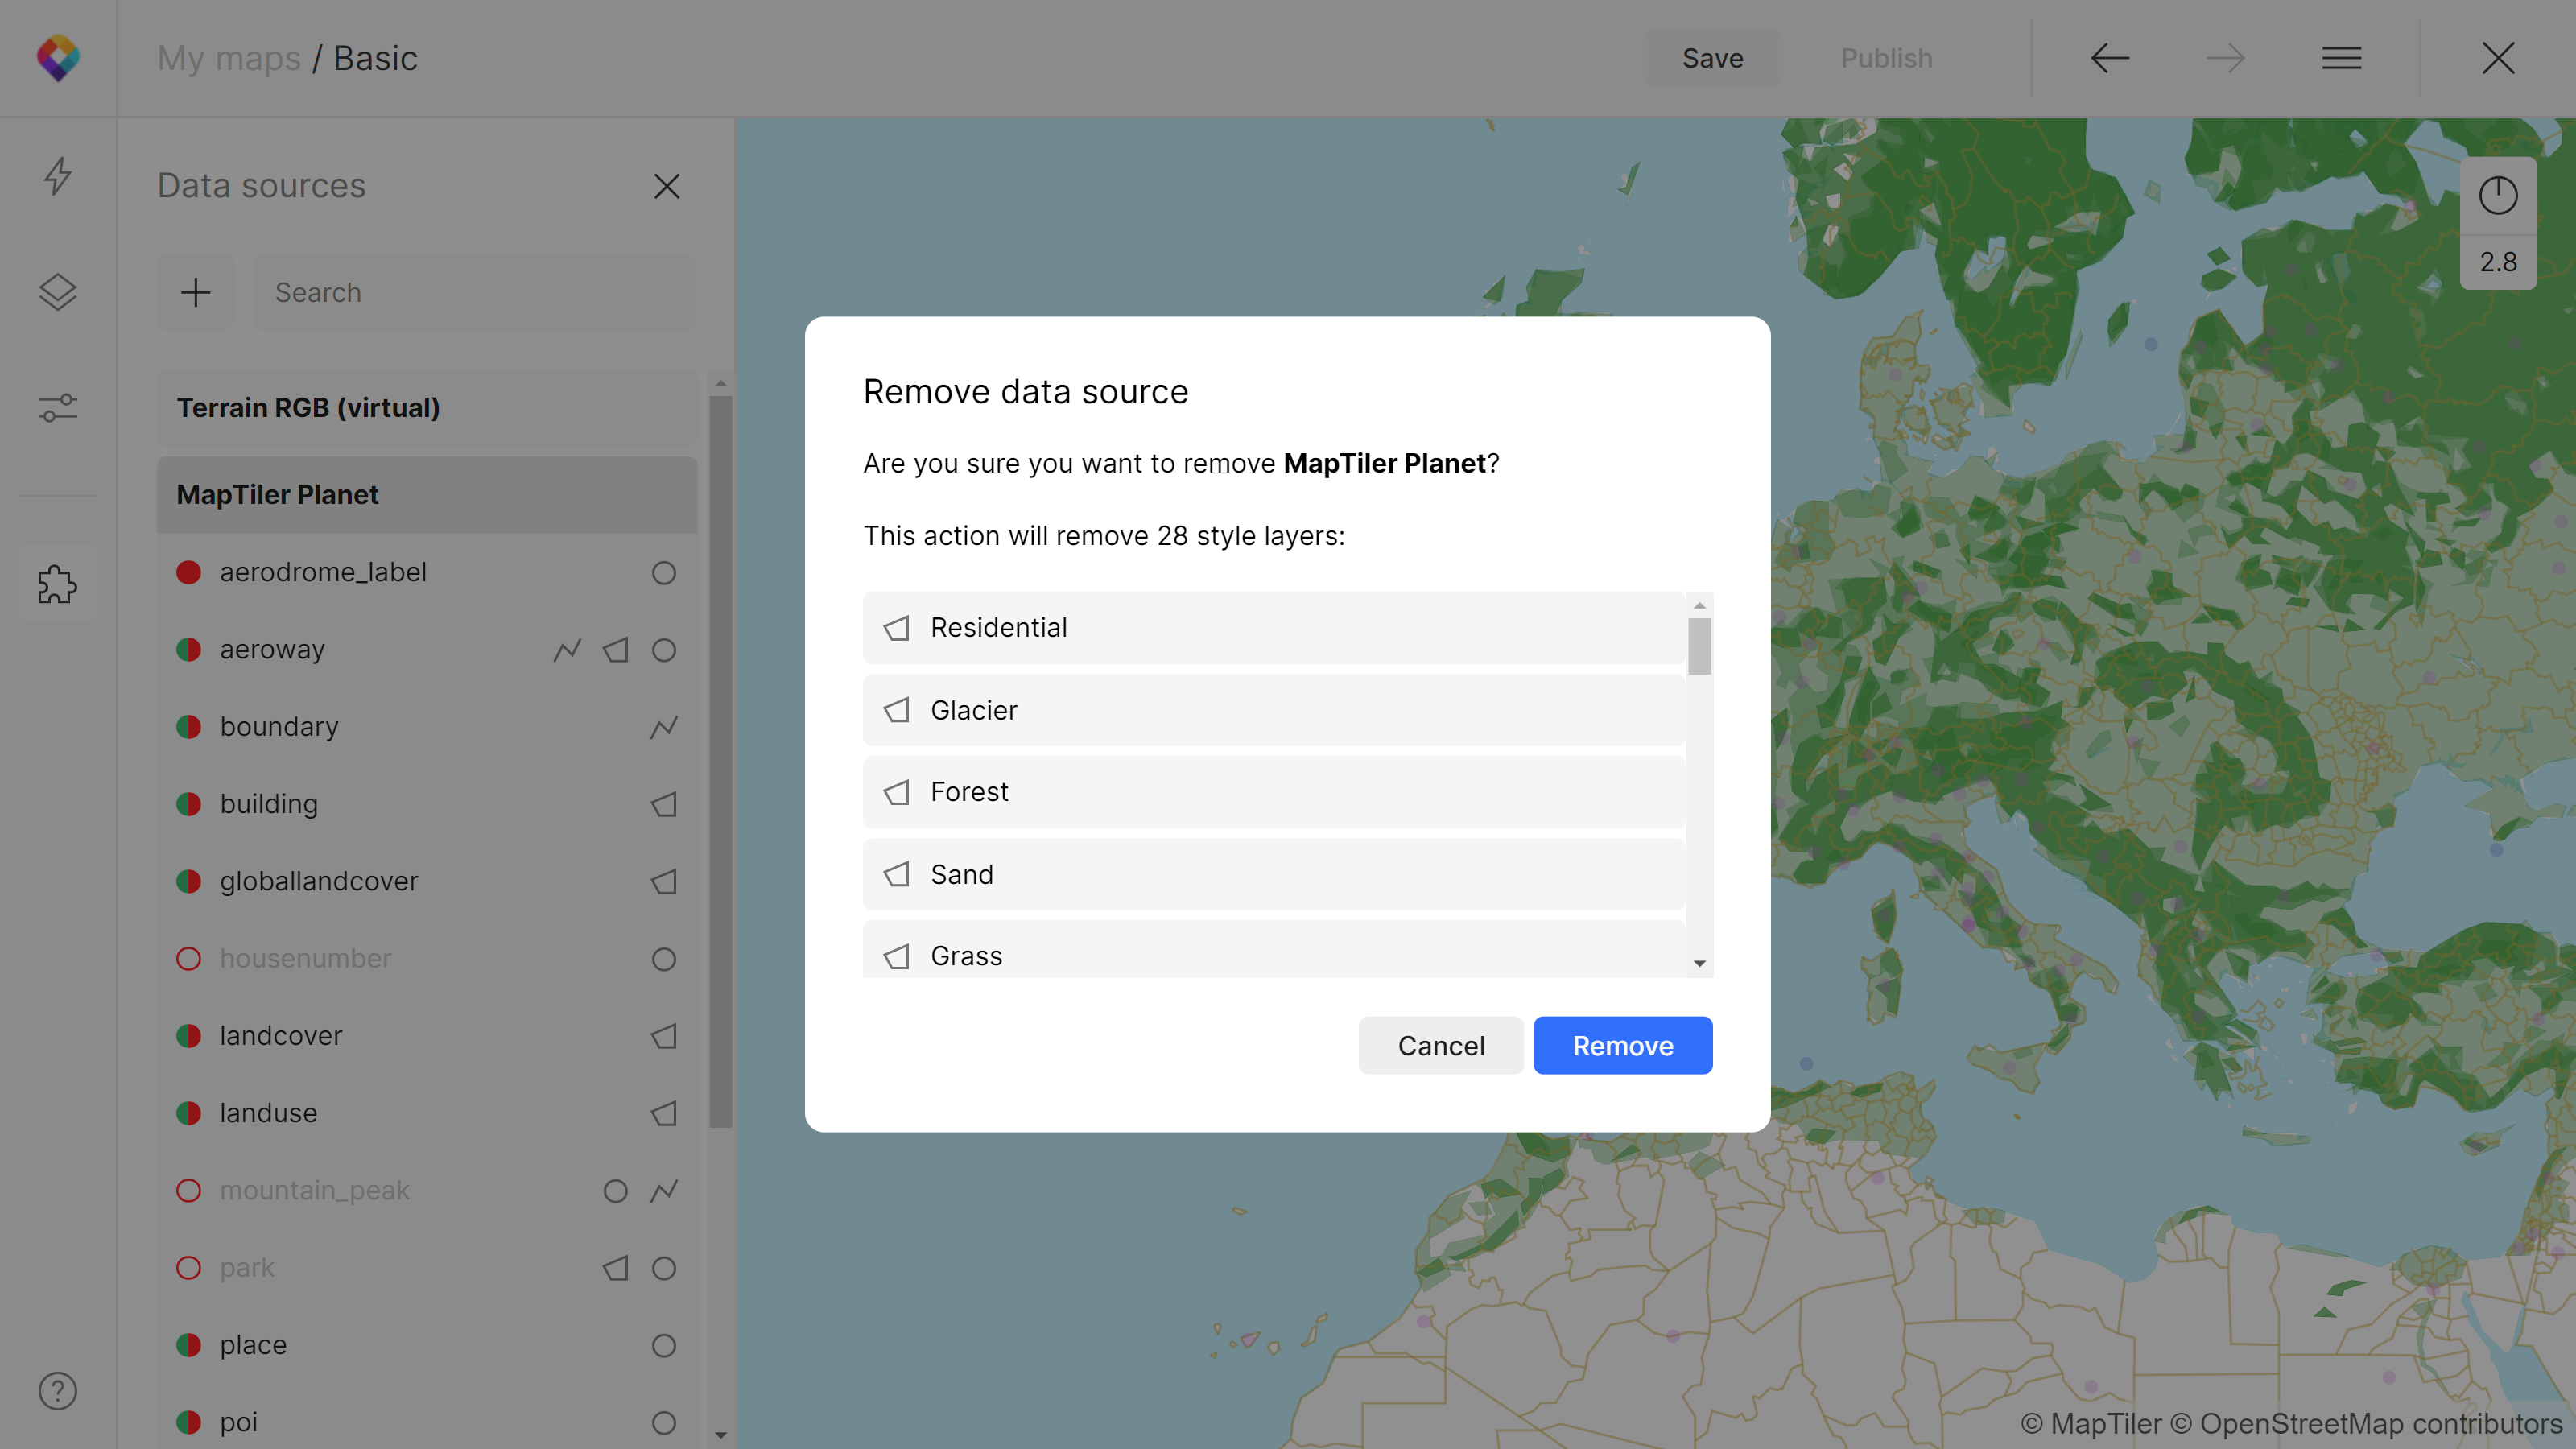
Replacing data sources can be very useful in case of updates. Go to the Data source panel > right-click the Data source > Replace data source… Data sources can be replaced only if they cover the same style layers as the initial source!
You can also delete a data source in the same manner. Map Designer will let you know if this action would cause any style layers to be removed from your map.