Editor interface
This page explains the basic concepts and controls of our no-code map design editor Map Designer to help you get around its interface.
Navigating the editor
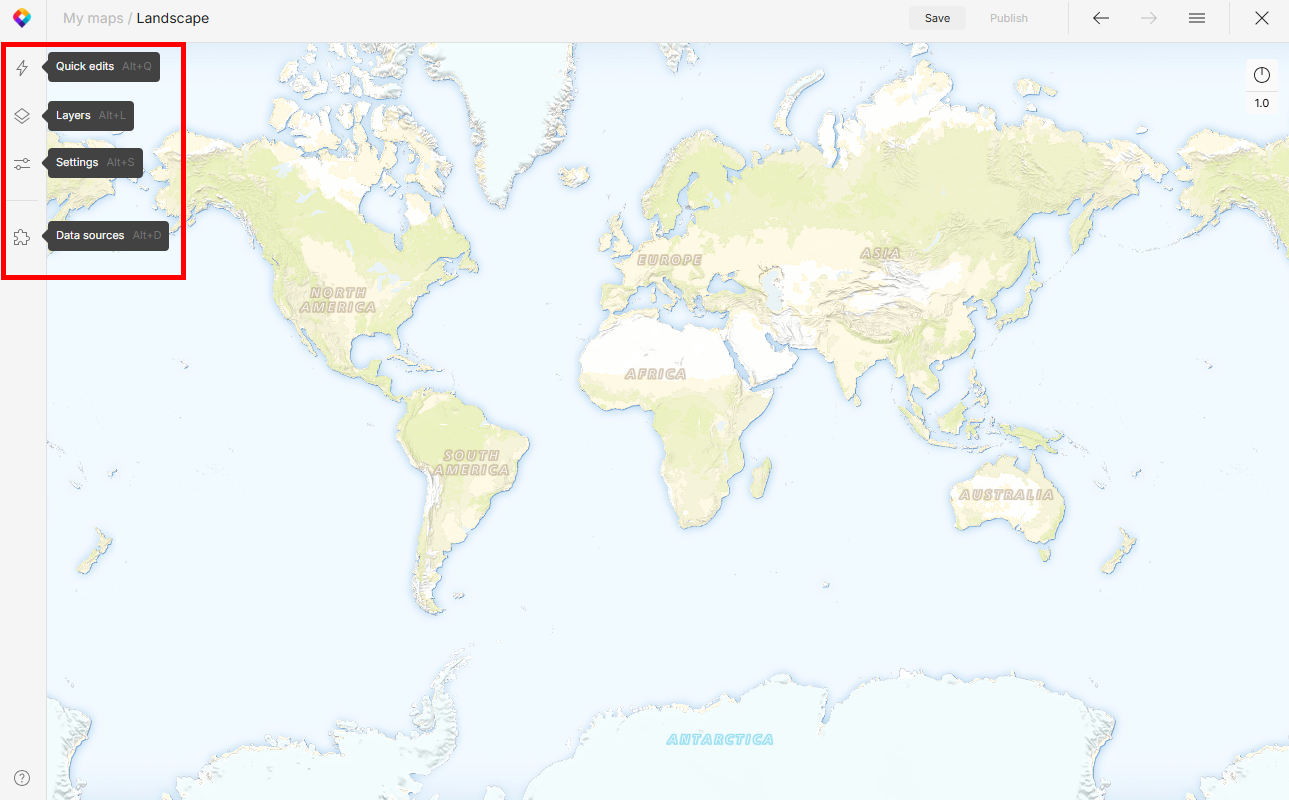
There are four panels on the left, each specific to map styling:
- Quick edits (Alt + Q) to easily adjustment map color palette and fonts. See Quick map editing.
- Layers (Alt + L) for complex styling of individual or multiple layers, filtering data or writing JSON.
- Settings (Alt + S) for setting global map options such as language, borders, or initial position.
- Data sources (Alt + D) for adding, removing, or replacing map data sources or checking data details.
What’s what
Map Style = a unique map, either one of MapTiler’s default styles or your own style.
MapLibre style/style.json = a JSON document that defines the visual appearance of a map: colors, layer order, data sources, etc. (every map style is a style.json file). This is what you get when you download a map style.
Layer = an entity in a map containing specific map features that are styled together (Road network); takes the data from a data source layer, optionally filters features, and defines how those features are styled.
Block = a group of layers.
Verticality = order of the layers in the map; the first one is rendered on top.
Style/Data = style panel serves for map design/data panel handles filters, geometry, or type of visualization.
Filter = specifies conditions on source data; only features that match the filter are displayed in the map.
- Filter Logic: All = returns
trueif all the inputs aretrue - Filter Logic: Any = returns
trueif any of the inputs aretrue - Filter Logic: None = returns
trueif none of the inputs aretrue
Attributes = information linked to the data that describes features and is used for filtering: class, admin_level, rank, name etc.
Layout properties = define how data for a layer is passed to the GPU; icon or text size, font, offset, visibility, text-field etc.
Paint properties = are applied later in the rendering process and happen synchronously: color, opacity, halo, width, etc.
Icon = properties for styling small images (icons) representing point data.
Text = properties for styling text labels such as font, size, or justification.
Fill = properties for styling fill of polygons such as color, opacity, or pattern.
Outline = properties for styling lines or borders of polygons: color, opacity, width, or style (dash array).
Layout = influences the placement of features: anchor, padding, overlap, etc.
Effects = includes blur of lines.
Default View = defines the initial position of the map with the zoom level, map center (latitude, longitude), tilt, and rotation angle.
Font Fallback = a font to which your default font switches in case of unsupported characters (Arabic, Cyrillic etc.).
Data source = source of map features (tiles or other data formats). Every layer needs to have one.
Data layer = an entity in a data source containing specific map features.
Geometry = encoding of geographic data, related to data representation: Polygon, LineString, Point etc.
Visualization = specifies the styling options; Polygon, Line, Point, Symbol, Heatmap etc.
Save = saves a map or your changes in the MapTiler interface.
Publish = publishes your changes into production across all your apps where the map is embedded.