Helpers 
![]() src/helpers/vectorlayerhelpers.ts
src/helpers/vectorlayerhelpers.ts
Helpers are a set of functions to facilitate the creation of sources and layers. All the helpers are made available under the helpers object.
Example
maptilersdk.helpers.addPolyline(map, {
  // dataset UUID, a URL (relative or absolute)
  data: "some-trace.geojson",
});
import { helpers } from "@maptiler/sdk";

helpers.addPolyline(map, {
  // dataset UUID, a URL (relative or absolute)
  data: "some-trace.geojson",
});
Vector layer helpers
Let’s make vector layers easy! Originally, you’d have to add a source and then proceed to the styling of your layer, which can be tricky because there are a lot of paint and layout options and they vary a lot from one type of layer to another. But we have helpers for this!
Vector Layer Helpers:
Shared logic
Helpers come with a lot of built-in defaults and some fail-proof logic that makes creating vector layers much easier! As a result, a dataset can be displayed in one call, creating both the datasource and the layer(s) in one go!
Depending on the type of feature to add (point, polyline, polygon or heatmap), a different helper function needs to be used, but datasource could contain mixed types of feature and the helper will only display a specific type. Example: we have a geoJSON file that contains both polygons and point and we use it as the data property on the helpers.addPoint(map, {options}), this will only add the points.
In addition to easy styling, helper’s datasource can be:
- a URL to a geoJSON file or its string content
- a URL to a GPX or KML file (only for the polyline helper) or its string content
- a UUID of a MapTiler dataset
Multiple layers
The key design principle of these vector layers helpers is it’s easy to make what you want. Helpers can create multiple layers to represent the symbolization of a layer, if necessary.
Example
To create a road with an outline with the polyline layer helper, you just say if you want an outline and specify its size (or even a zoom dependant size) and everything is handled for you. As a result, the helpers.addPolyline method will return an object with multiple IDs: ID of the top/main layer, ID of the outline layer (could be null) and the ID of the data source. This makes further layer and source manipulation possible.
Without the helpers to create a road with an outline, one must draw two layers: a wider base layer and a narrower top layer, fueled by the same polyline data. This requires ordering the layers properly and computing not the width of the outline, but rather the width of the polyline underneath so that it outgrows the top road layer of the desired number of pixels.
CommonShapeLayerOptions
The vector layer helper also share some I/O logic: each of them can take many options but a subset of them is common across all the helpers:
| options.layerId? (string)
|
ID to give to the layer. If not provided, an auto-generated ID like "maptiler-layer-xxxxxx" will be auto-generated, with "xxxxxx" being a random string. |
|---|---|
| options.sourceId? (string)
|
ID to give to the source. If not provided, an auto-generated ID like "maptiler-source-xxxxxx" will be auto-generated, with "xxxxxx" being a random string. |
| options.data (
FeatureCollection |
string)
|
A geojson Feature collection or a URL to a geojson or the UUID of a MapTiler dataset. |
| options.beforeId? (string)
|
The ID of an existing layer to insert the new layer before, resulting in the new layer appearing visually beneath the existing layer. If this argument is not specified, the layer will be appended to the end of the layers array and appear visually above all other layers. |
| options.minzoom? (number)
default: 0
|
Zoom level at which it starts to show. |
| options.maxzoom? (number)
default: 22
|
Zoom level after which it no longer show. |
| options.outline? (boolean)
default: false
|
Whether or not to add an outline. |
| options.outlineColor?
default:
white |
Color of the outline. This is can be a constant color string or a definition based on zoom levels.
Applies only if .outline is true.
|
| options.outlineWidth?
default: 1
|
Width of the outline (relative to screen-space). This is can be a constant width or a definition based on zoom levels.
Applies only if .outline is true.
|
| options.outlineOpacity?
default: 1
|
Opacity of the outline. This is can be a constant opacity in [0, 1] or a definition based on zoom levels.
Applies only if .outline is true.
|
Polyline layer helper
The polyline helper makes it easy to create vector layers that contain polylines. Whenever it’s possible and it makes sense, we use the same terminology across the different helpers.
Methods
The method helpers.addPolyline is not only compatible with the traditionnal GeoJSON source but also with GPX and KML files and the data option can be a MapTiler dataset UUID and will be resolved automatically.
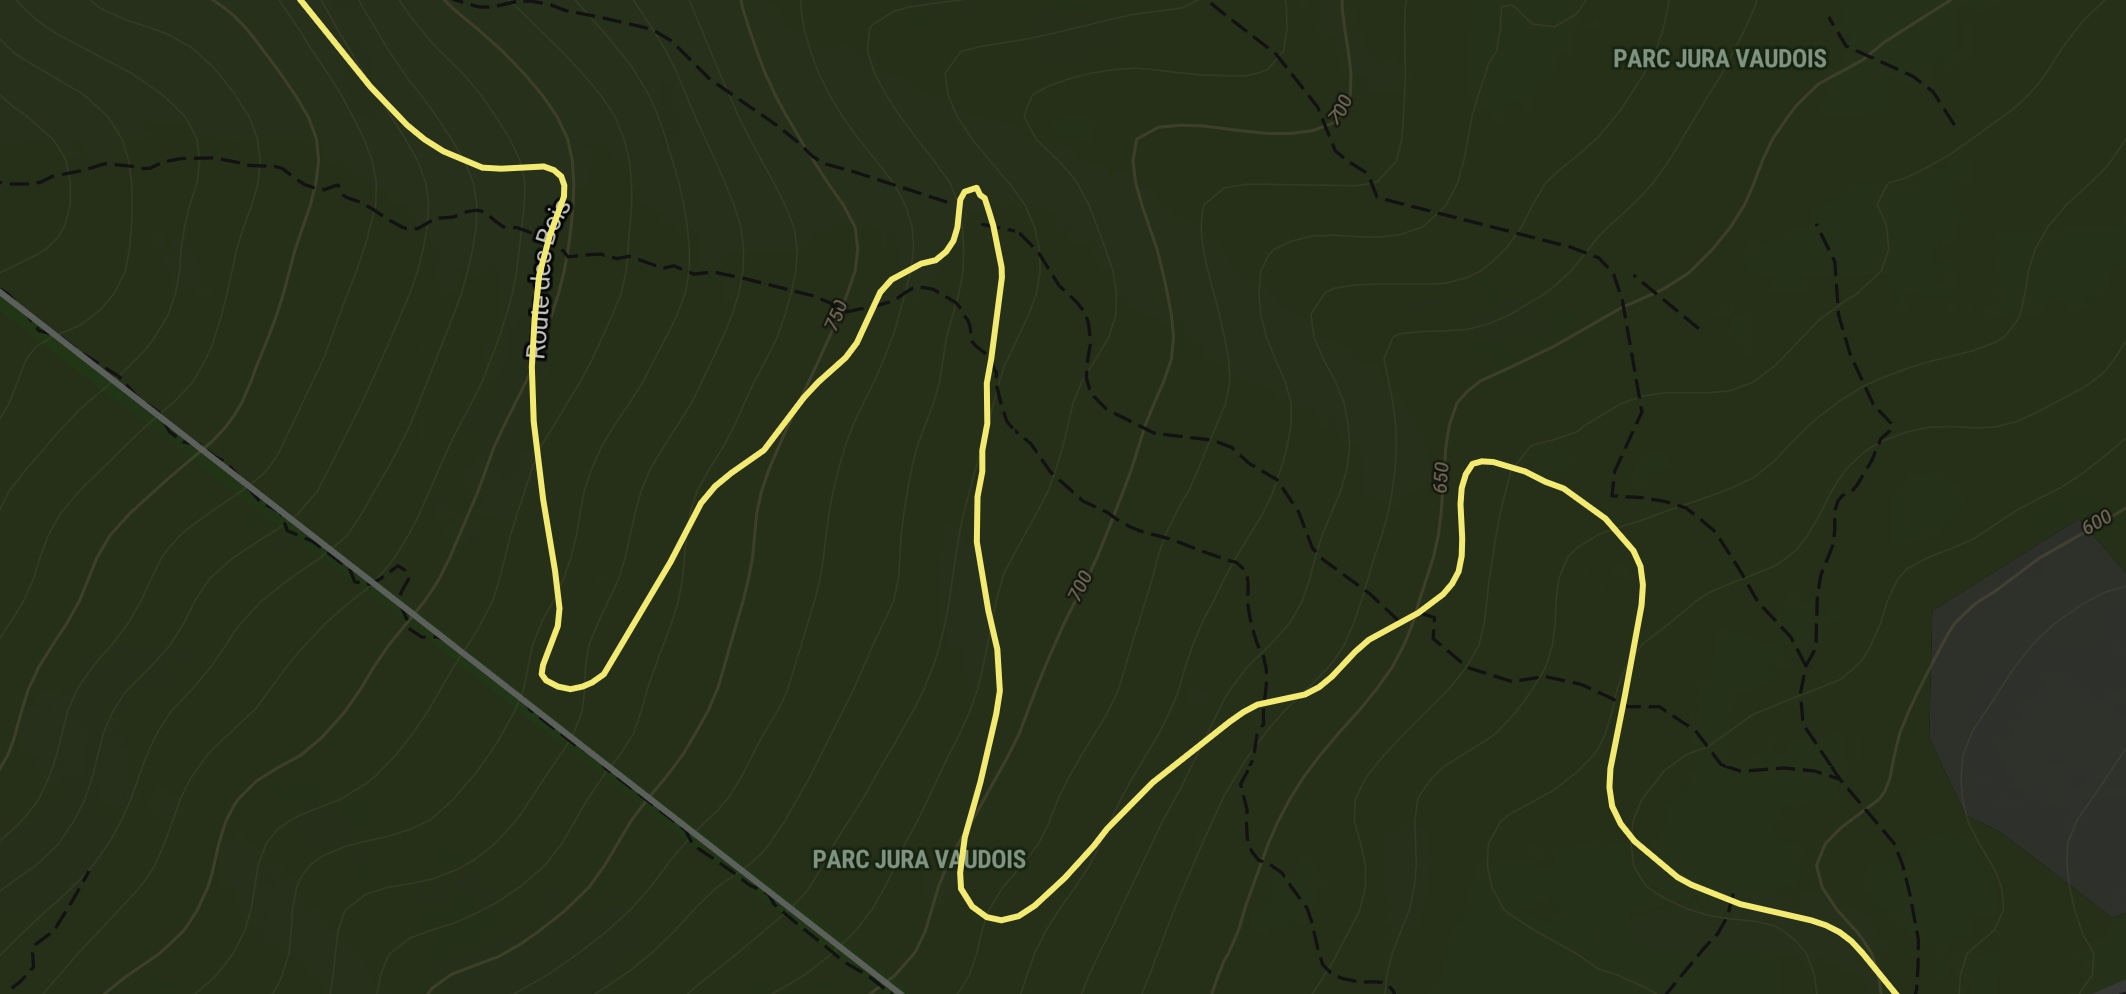
Minimal usage, with the default line width and a random color (withing a selected list):
import { helpers } from "@maptiler/sdk";

helpers.addPolyline(map, {
  // dataset UUID, a URL (relative or absolute)
  data: "some-trace.geojson",
});
Add a polyline to the map from various sources and with builtin styling.
Compatible sources:
- uuid of a MapTiler dataset
- geojson from url
- geojson content as string
- geojson content as JS object
- gpx content as string
- gpx file from URL
- kml content from string
- kml from url
The method also gives the possibility to add an outline layer (if `options.outline` is `true`) and if so , the returned property `polylineOutlineLayerId` will be a string. As a result, two layers would be added.
The default styling creates a line layer of constant width of 3px, the color will be randomly picked from a curated list of colors and the opacity will be 1. If the outline is enabled, the outline width is of 1px at all zoom levels, the color is white and the opacity is 1.
Those style properties can be changed and ramped according to zoom level using an easier syntax.
RequestInit?)
: An object containing any custom settings that you want to apply to the request.
Promise: {
polylineLayerId: string;
polylineOutlineLayerId: string;
polylineSourceId: string;
}
PolylineLayerOptions
Extends CommonShapeLayerOptions
| options.lineColor?
default: a color randomly pick from a list
|
Color of the line (or polyline). This is can be a constant color string or a definition based on zoom levels. |
|---|---|
| options.lineWidth?
default: 3
|
Width of the line (relative to screen-space). This is can be a constant width or a definition based on zoom levels. |
| options.lineOpacity?
default: 1
|
Opacity of the line. This is can be a constant opacity in [0, 1] or a definition based on zoom levels. |
| options.lineBlur?
default: 0
|
How blury the line is, with `0` being no blur and `10` and beyond being quite blurry. |
| options.lineGapWidth?
default: 0
|
Draws a line casing outside of a line's actual path. Value indicates the width of the inner gap. |
| options.lineDashArray?
default: no dash pattern
|
Sequence of line and void to create a dash pattern. The unit is the line width so that
a dash array value of
Alternatively, this property can be a string made of underscore and whitespace characters
such as
Dash arrays can contain more than 2 element to create more complex patters. For instance
a dash array value of
|
| options.lineCap? (
"butt" |
"round" | "square")
default:
"round" |
The display of line endings for both the line and the outline
(if .outline is true).
|
| options.lineJoin? (
"bevel" |
"round" | "miter")
default:
"round" |
The display of lines when joining for both the line and the outline
(if .outline is true).
|
| options.outlineBlur?
default: 0
|
How blury the outline is, with `0` being no blur and `10` and beyond being quite blurry.
Applies only if .outline is true.
|
Examples
Check out the full list of examples.
We can add many options, such a a specific color, a custom width or a dash pattern, this time sourcing the data from MapTiler, using the UUID of a dataset:
import { helpers } from "@maptiler/sdk";

helpers.addPolyline(map, {
  data: "74003ba7-215a-4b7e-8e26-5bbe3aa70b05",
  lineColor: "#FF6666",
  lineWidth: 4,
  lineDashArray: "____ _ ",
  lineCap: "butt",
});
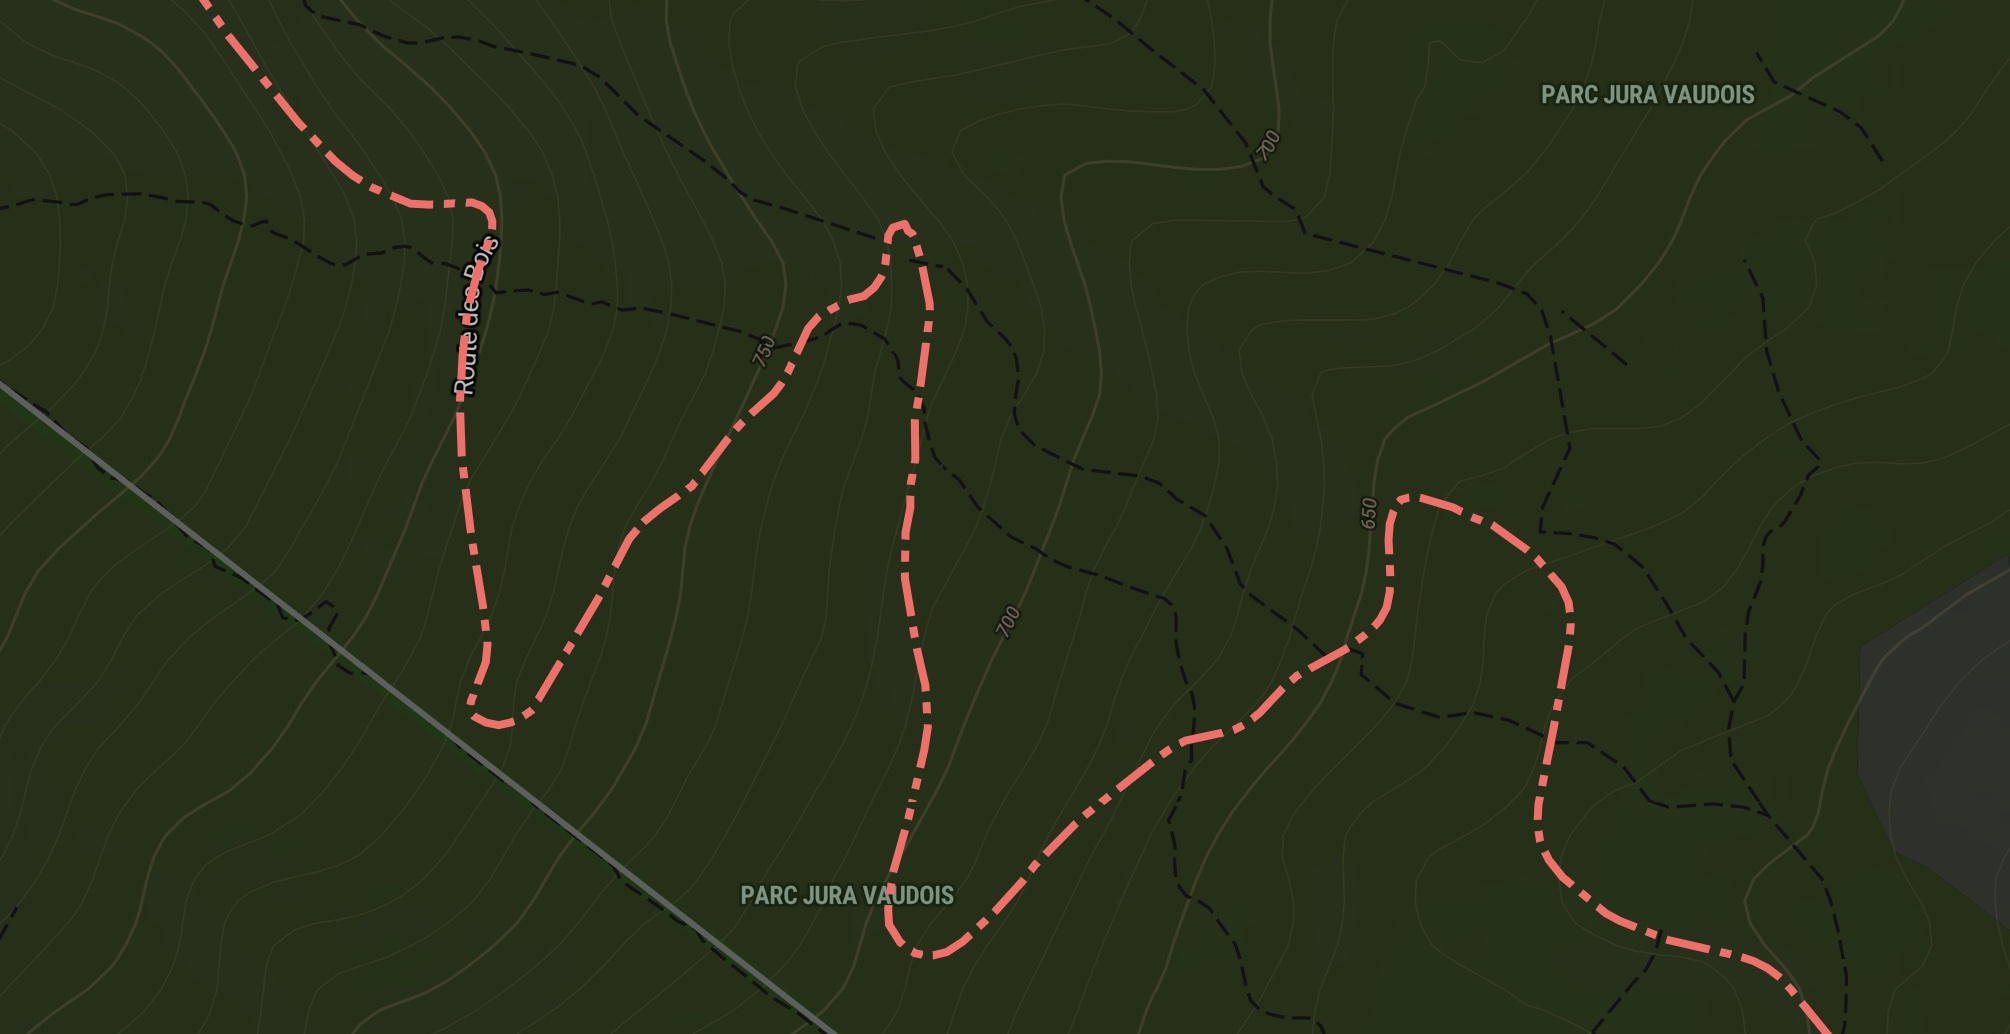
As you can see, we’ve come up with a fun and easy way to create dash arrays, just use underscores and white spaces and this pattern will repeat!
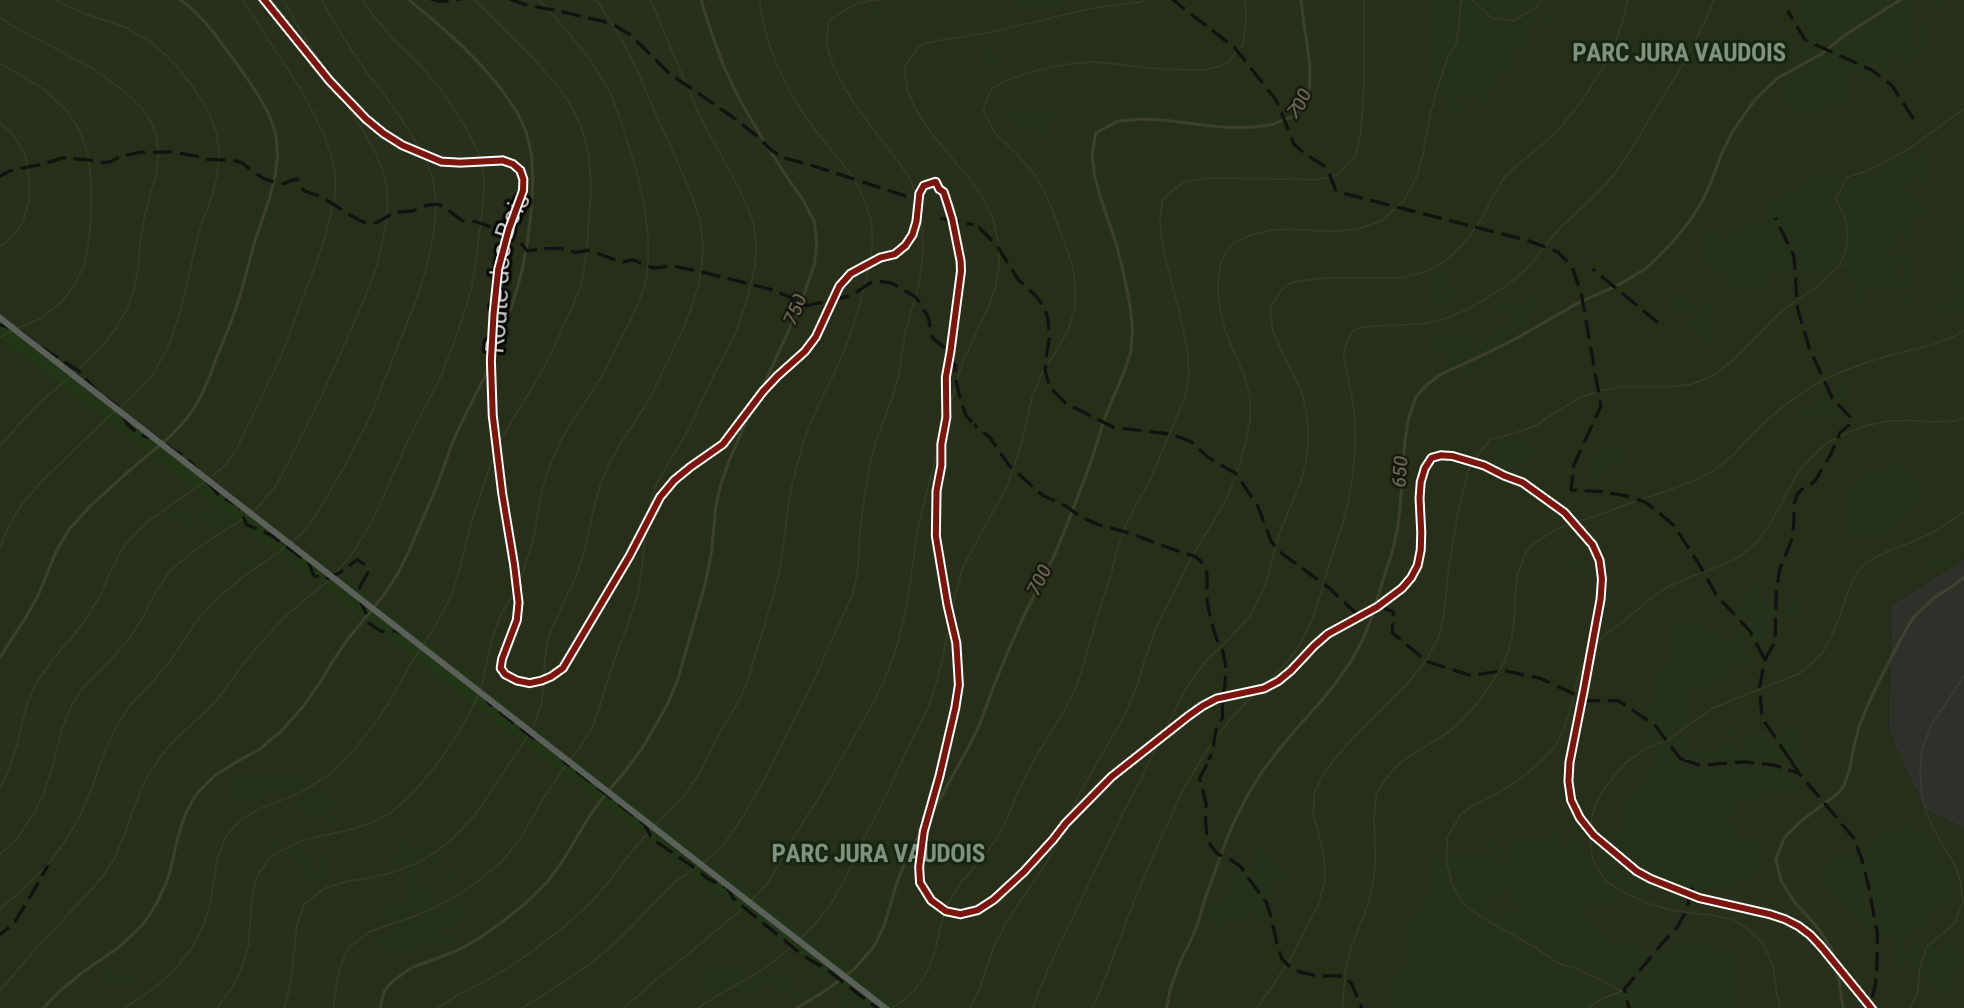
Adding an outline is also pretty straightforward:
import { helpers } from "@maptiler/sdk";

helpers.addPolyline(map, {
  data: "74003ba7-215a-4b7e-8e26-5bbe3aa70b05",
  lineColor: "#880000",
  outline: true,
});
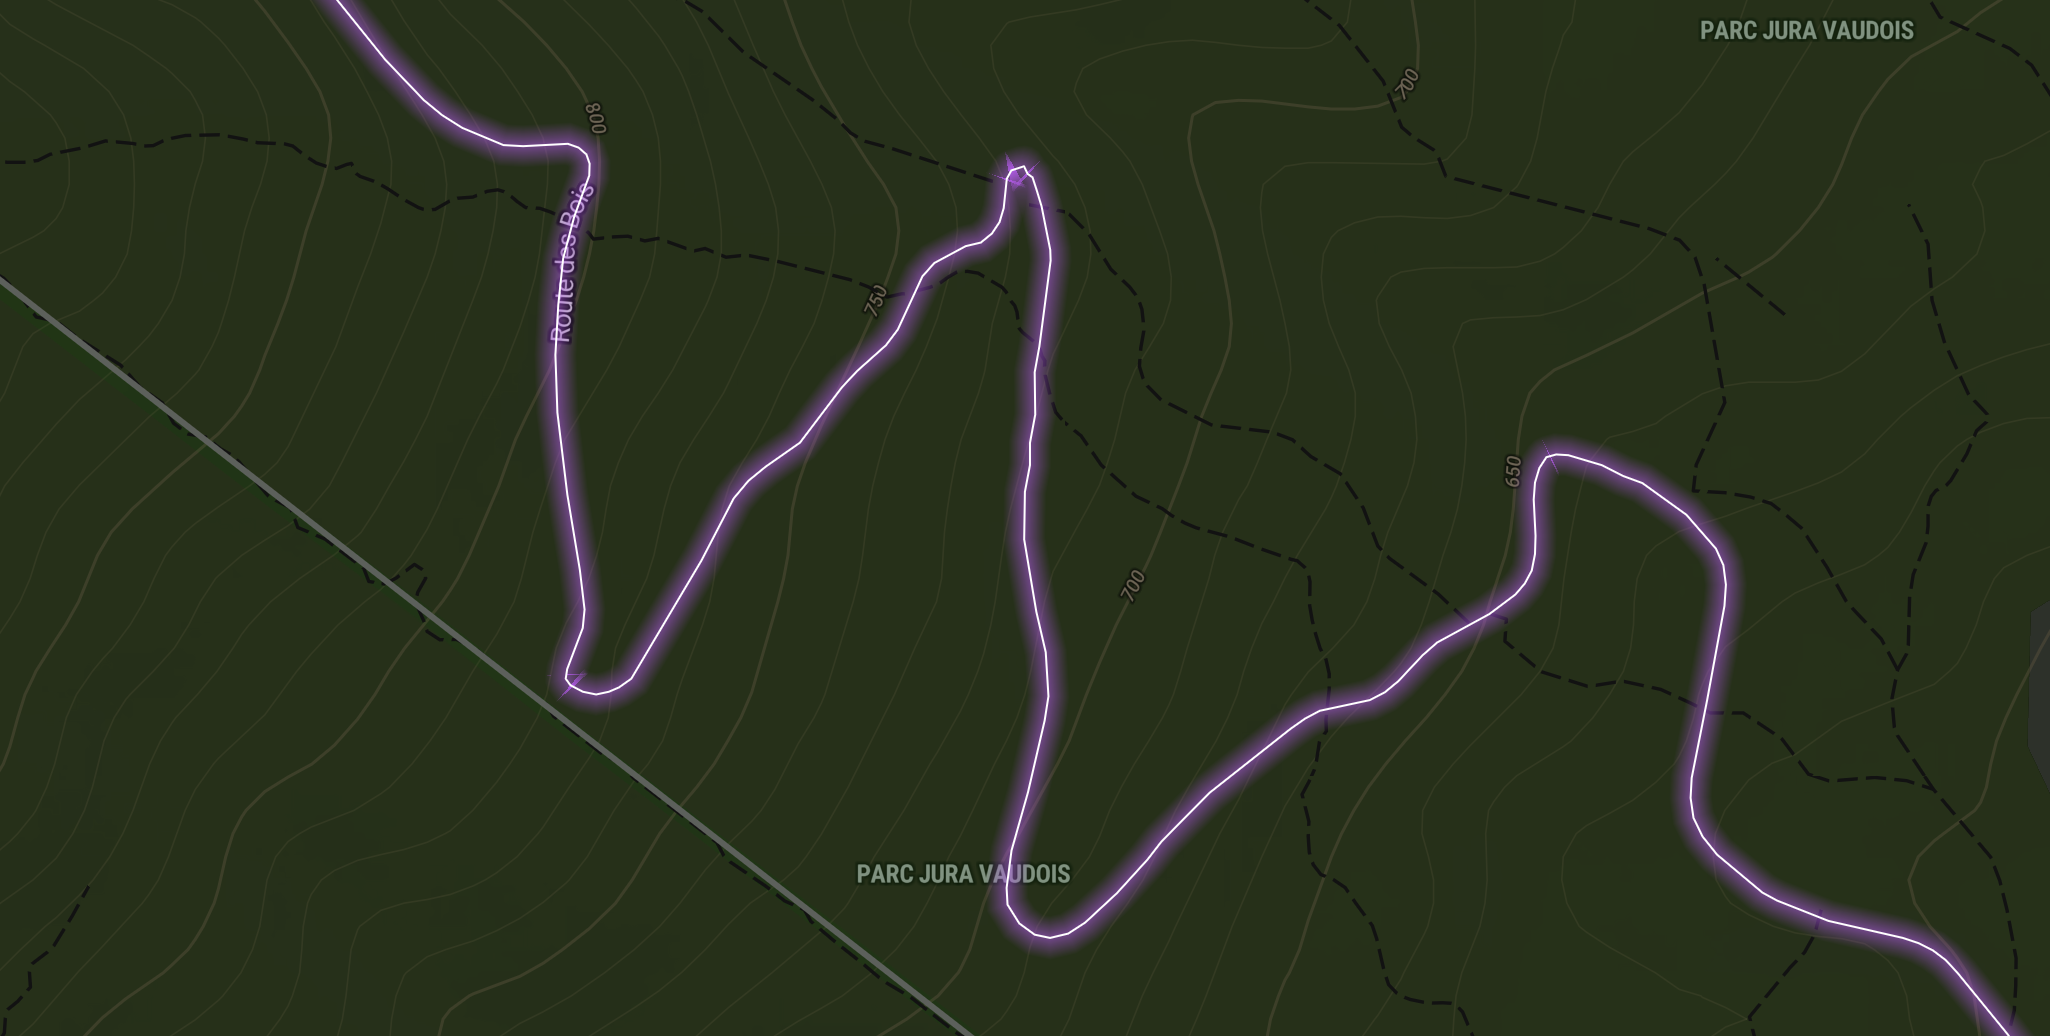
Endless possibilities, what about a glowing wire?
import { helpers } from "@maptiler/sdk";

helpers.addPolyline(map, {
  data: "74003ba7-215a-4b7e-8e26-5bbe3aa70b05",
  lineColor: "#fff",
  lineWidth: 1,
  outline: true,
  outlineColor: "#ca57ff",
  outlineWidth: 2,
  outlineWidth: 10,
  outlineBlur: 10,
  outlineOpacity: 0.5,
});
View more Polyline layer helper examples.
Polygon layer helper
The polygon helper makes it easy to create vector layers that contain polygons, whether they are multipolygons, holedpolygons or just simple polygons. Whenever it’s possible and it makes sense, we use the same terminology across the different helpers.
Methods
Minimal usage, with a half-transparent and a random color (withing a selected list) polygon of Switzerland, from a local file:
import { helpers } from "@maptiler/sdk";

helpers.addPolygon(map, {
  data: "switzerland.geojson",
  fillOpacity: 0.5,
});
Add a polygon with styling options.
Compatible sources:
- uuid of a MapTiler dataset
- geojson from url
- geojson content as string
- geojson content as JS object
The method also gives the possibility to add an outline layer (if `options.outline` is `true`) and if so, the returned property `polygonOutlineLayerId` will be a string. As a result, two layers would be added.
The default styling creates a line layer of constant width of 3px, the color will be randomly picked from a curated list of colors and the opacity will be 1. If the outline is enabled, the outline width is of 1px at all zoom levels, the color is white and the opacity is 1.
Those style properties can be changed and ramped according to zoom level using an easier syntax.
Promise: {
polygonLayerId: string;
polygonOutlineLayerId: string;
polygonSourceId: string;
}
![]()
PolygonLayerOptions
Extends CommonShapeLayerOptions
| options.fillColor?
default: a color randomly pick from a list
|
Color of the polygon. This is can be a constant color string or a definition based on zoom levels. |
|---|---|
| options.fillOpacity?
default: 1
|
Opacity of the polygon. This is can be a constant opacity in [0, 1] or a definition based on zoom levels. |
| options.outlinePosition? (
"center" |
"inside" | "outside")
default:
"center" |
Position of the outline with regard to the polygon edge
(when .outline is true).
|
| options.outlineDashArray?
default: no dash pattern
|
Sequence of line and void to create a dash pattern. The unit is the line width so that
a dash array value of
Alternatively, this property can be a string made of underscore and whitespace characters
such as
Dash arrays can contain more than 2 element to create more complex patters. For instance
a dash array value of
|
| options.outlineCap? (
"butt" |
"round" | "square")
default:
"round" |
The display of line endings for both the line and the outline
(if .outline is true).
|
| options.outlineJoin? (
"bevel" |
"round" | "miter")
default:
"round" |
The display of lines when joining for both the line and the outline
(if .outline is true).
|
| options.pattern?
default: null (no pattern,
fillColor will be used) |
The pattern is an image URL to be put as a repeated background pattern of the polygon. |
| options.outlineBlur?
default: 0
|
How blury the outline is, with `0` being no blur and `10` and beyond being quite blurry.
Applies only if .outline is true.
|
Examples
Check out the full list of examples.
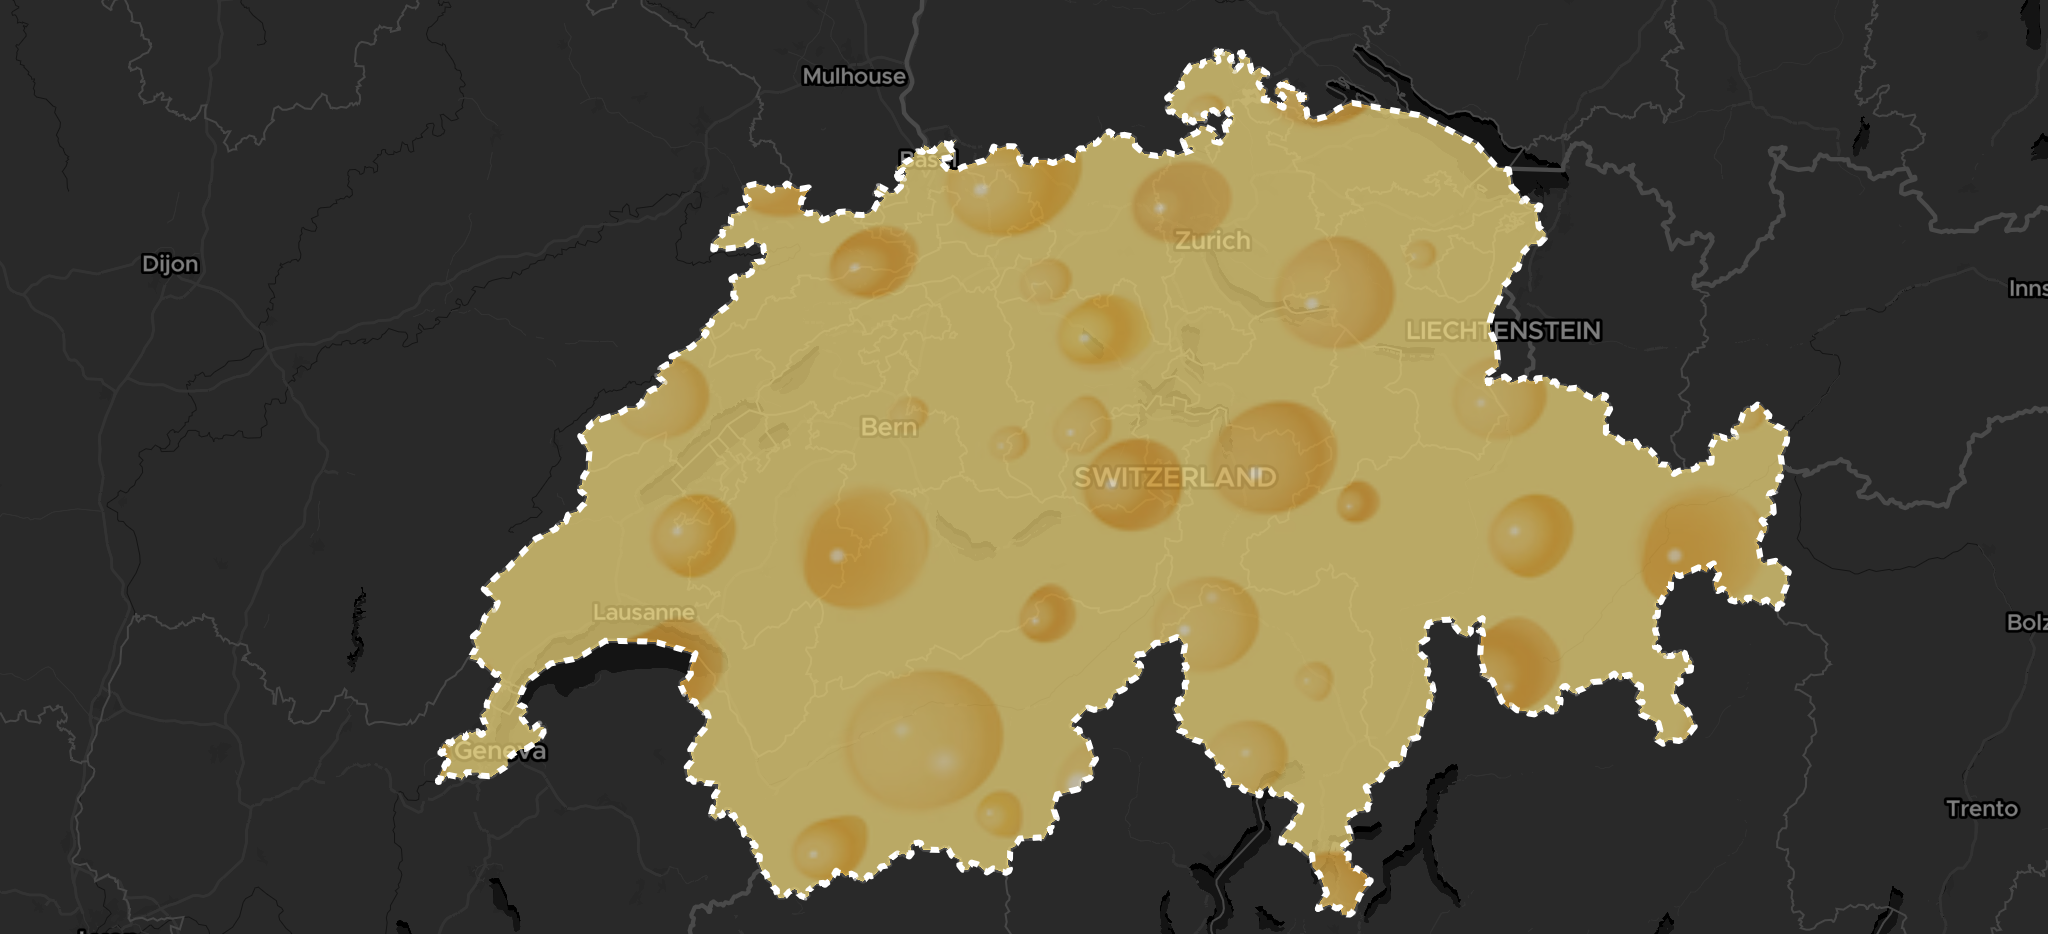
We can add many options, such a a specific color, a custom width or a pattern, this time sourcing the data from MapTiler, using the UUID of a dataset:
import { helpers } from "@maptiler/sdk";

helpers.addPolygon(map, {
  data: "aa203ccf-25ee-4447-bef3-55f90916897a",
  pattern: "cheese512.png",
  outline: true,
  outlineWidth: 3,
  outlineColor: "white",
  outlineDashArray: "_ ",
  fillOpacity: 0.7,
});
View more Polygon layer helper examples.
Point layer helper
A point visualisation may appear like the simplest of all, but we noticed this is where people get the most creative: cluster, data-drive variable radius, but also scaled with zoom, with or without labels, data-driven colors, etc. Our helper supports all of these and will fill-in with built-in default for what’s missing. Whenever it’s possible and it makes sense, we use the same terminology across the different helpers.
Methods
Here is the simplest example, with a dataset loaded from a local file (if no color is specified, a random color is used and the default radius is ramped over the zoom level):
import { helpers } from "@maptiler/sdk";

helpers.addPoint(map, {
  data: "public-schools.geojson",
});
Add a point with styling options.
Compatible sources:
- uuid of a MapTiler dataset
- geojson from url
- geojson content as string
- geojson content as JS object
The default styling creates a point layer of default radius ramped over the zoom level, the color will be randomly picked from a curated list of colors and the opacity will be 1. If the outline is enabled, the outline width is of 1px at all zoom levels, the color is white and the opacity is 1.
Those style properties can be changed and ramped according to zoom level using an easier syntax.
Promise: {
pointLayerId: string;
clusterLayerId: string;
labelLayerId: string;
pointSourceId: string;
}
PointLayerOptions
Extends CommonShapeLayerOptions
| options.pointColor?
default: a color randomly pick from a list
|
Color of the point. This is can be a constant color string or a definition based on zoom levels. Can be a unique point color as a string (CSS color such as "#FF0000" or "red"). Alternatively, the color can be a ColorRamp with a range.
In case of |
|---|---|
| options.pointRadius?
default: The radius will be between
.minPointRadius
and .maxPointRadius |
Radius of the points. Can be a fixed size or a value dependant on the zoom.
If |
| options.minPointRadius? (number)
default: 10
|
The minimum point radius posible. |
| options.maxPointRadius? (number)
default: 40
|
The maximum point radius posible. |
| options.property? (string)
default: none
|
The point property to observe and apply the radius and color upon.
This is ignored if .cluster is true
as the observed value will be fiorced to being the number of elements in each cluster.
|
| options.pointOpacity?
default: 1
|
Opacity of the point or icon. This is can be a constant opacity in [0, 1] or a definition based on zoom levels.
Alternatively, if not provided but the |
| options.alignOnViewport? (boolean)
default: true
|
If true, the points will keep their circular shape align with the wiewport.
If false, the points will be like flatten on the map. This difference shows when the map is tilted.
|
| options.cluster? (boolean)
default: false
|
Whether the points should cluster |
| options.showLabel? (boolean)
default:
true if .cluster
or dataDrivenStyleProperty are used, false otherwise |
Shows a label with the numerical value id true.
If .cluster is true, the value will be the number of elements in the cluster.
|
| options.labelColor? (string)
default:
white |
Text color used for the number elements in each cluster.
Applicable only when .cluster is true or
dataDrivenStyleProperty are used.
|
| options.labelSize? (number)
default: 12
|
Text size used for the number elements in each cluster.
Applicable only when .cluster is true.
|
| options.zoomCompensation? (boolean)
default: true
|
Only if .cluster is false.
If the radius is driven by a property, then it will also scale by zoomming if .zoomCompensation is true.
If false, the radius will not adapt according to the zoom level.
|
Examples
Check out the full list of examples.
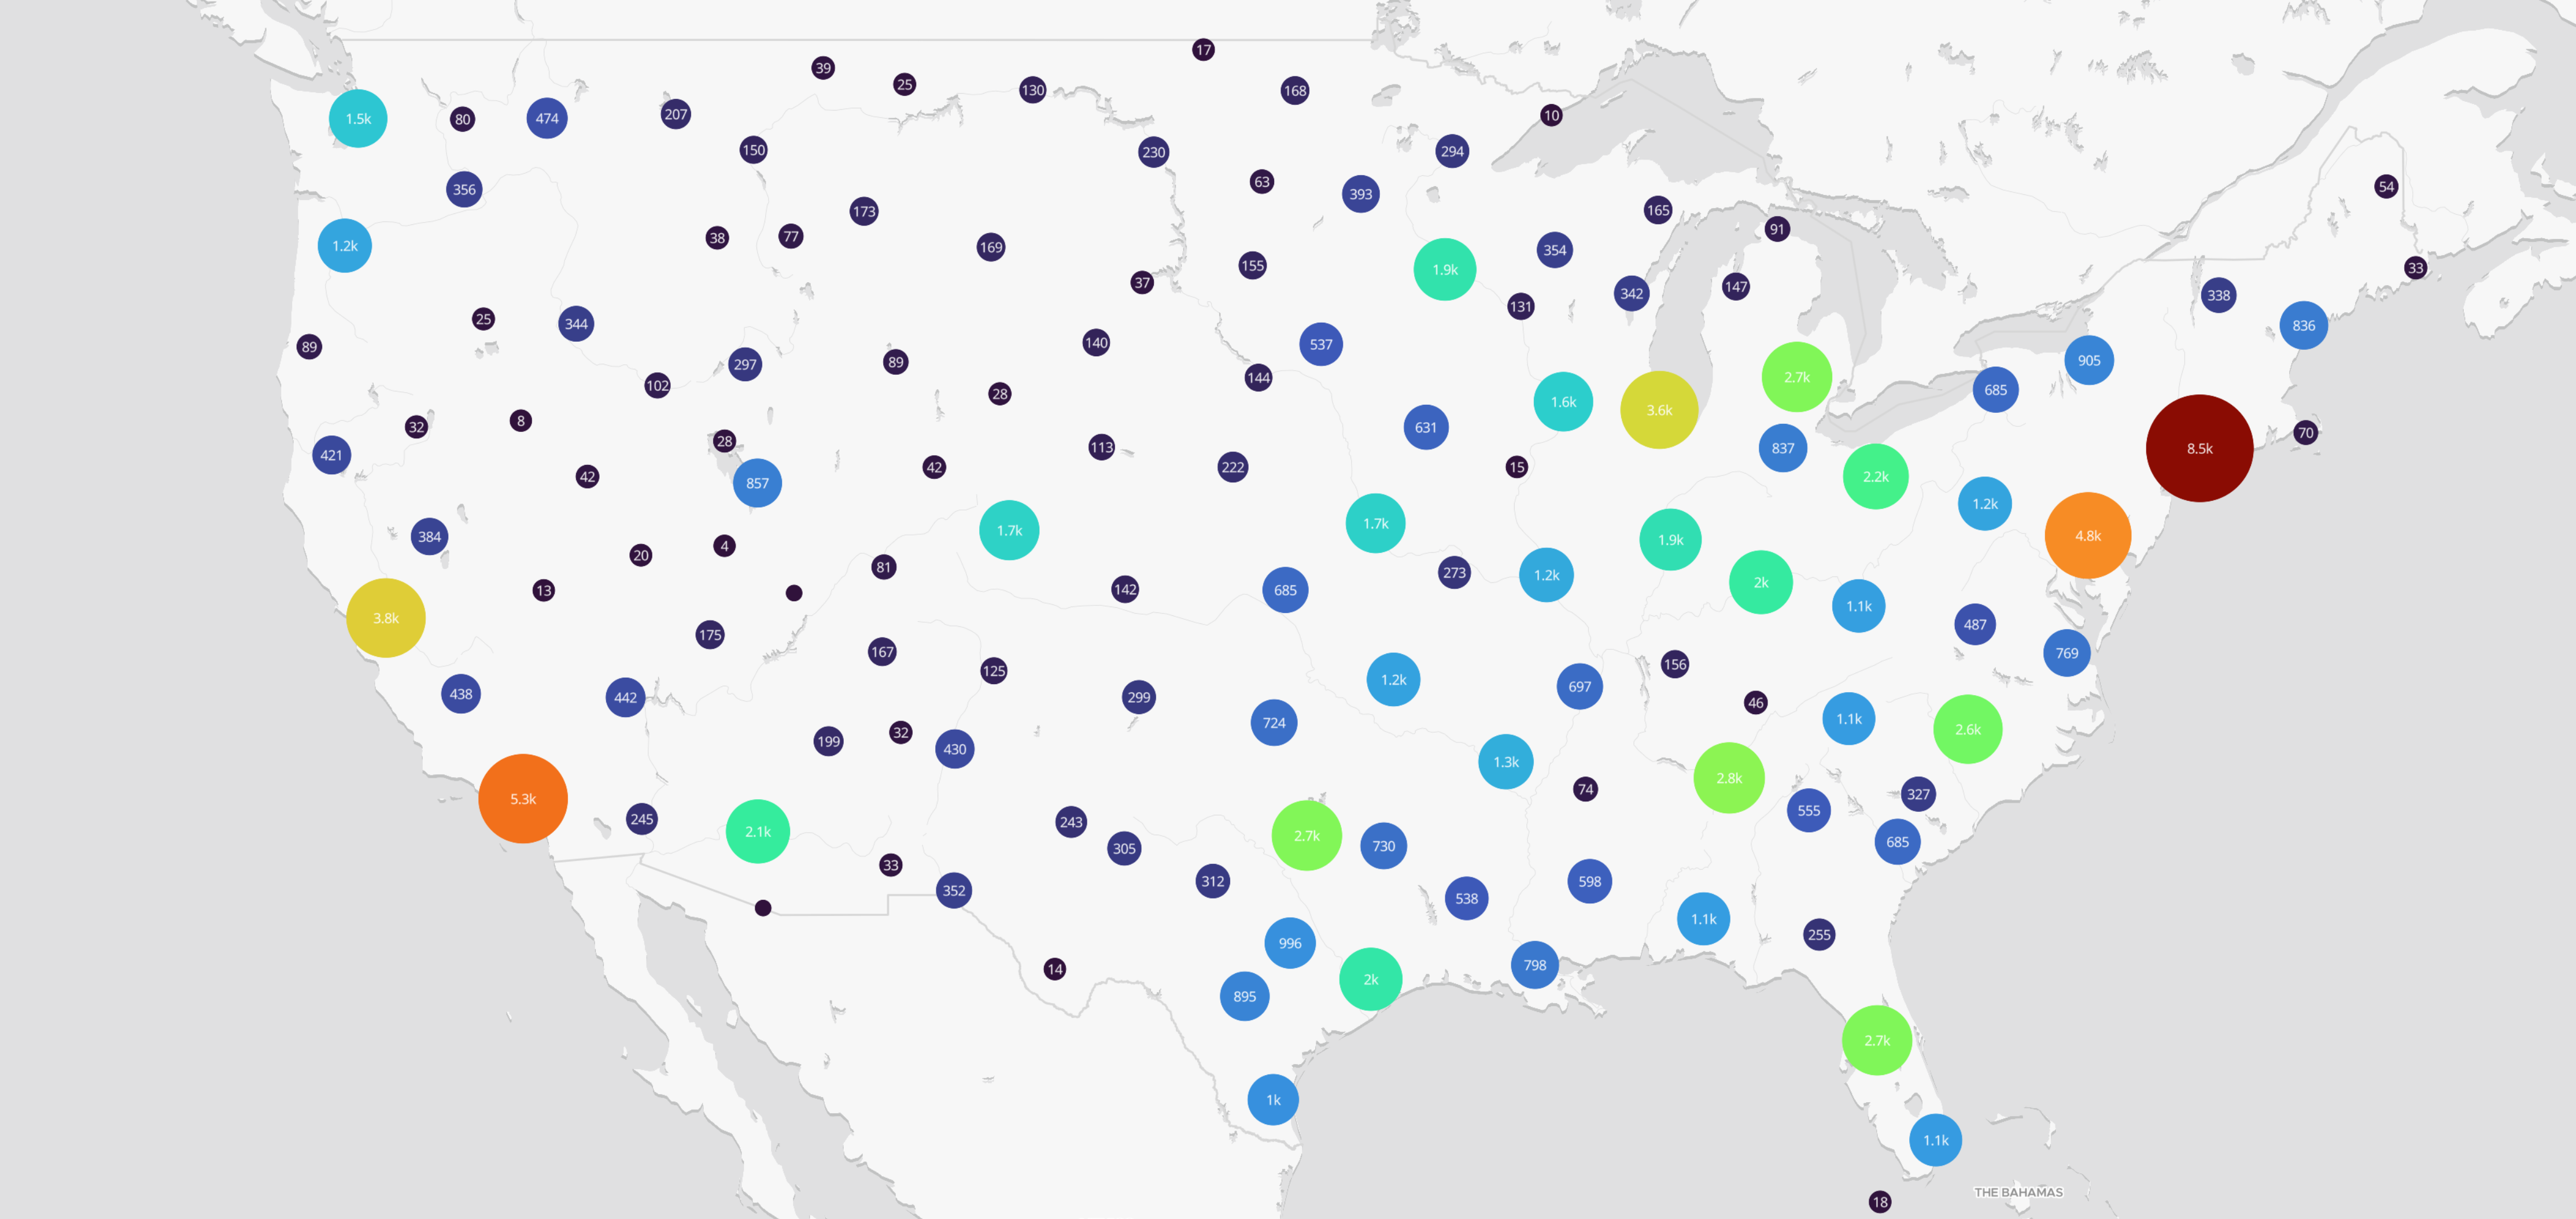
Here is the same dataset, but with point clustering enabled:
import { helpers } from "@maptiler/sdk";

helpers.addPoint(map, {
  data: "public-schools.geojson",
  cluster: true,
});
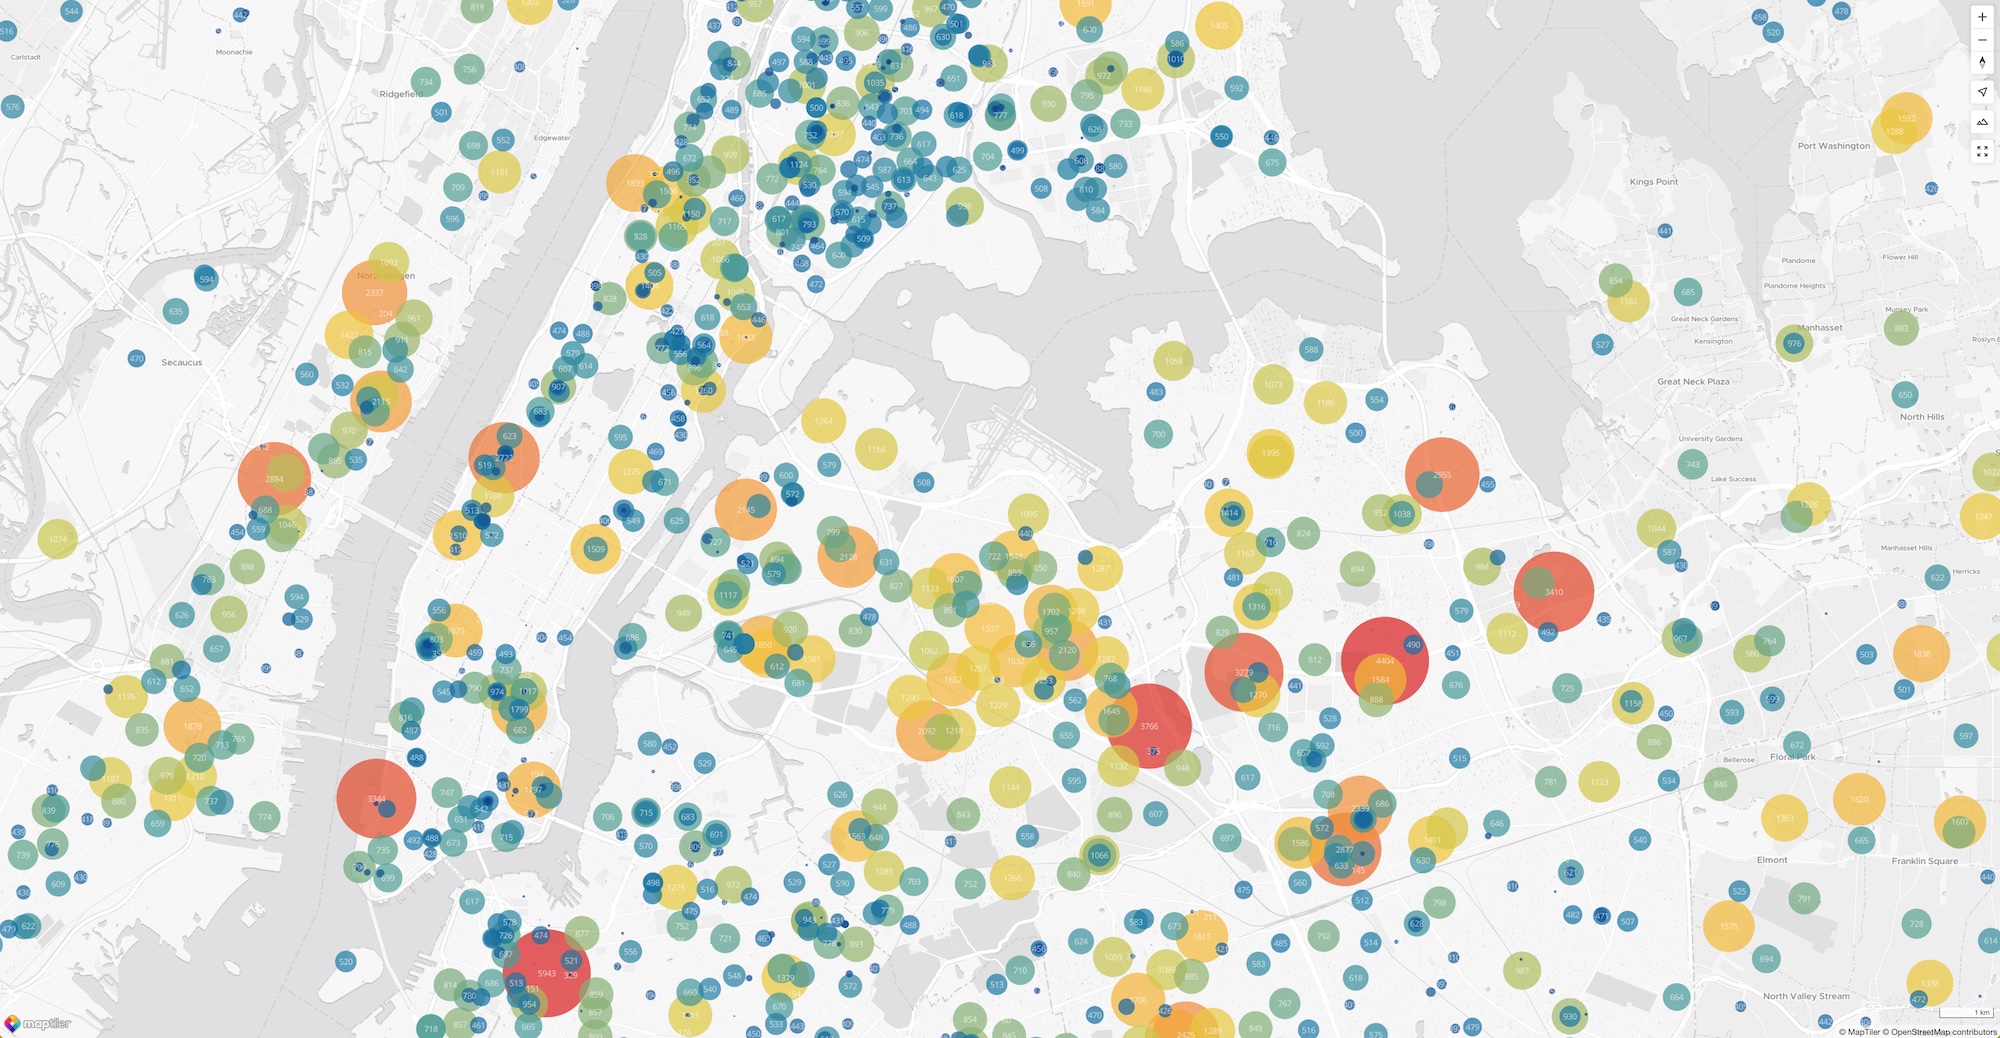
On the other hand, if clusters are enabled, the default color is fueled by the color ramp TURBO scaled from 10 to 10000 non-linearly resampled with the method "ease-out-square". The size also varies from minPointradius (default: 10) to maxPointRadius (default: 50):
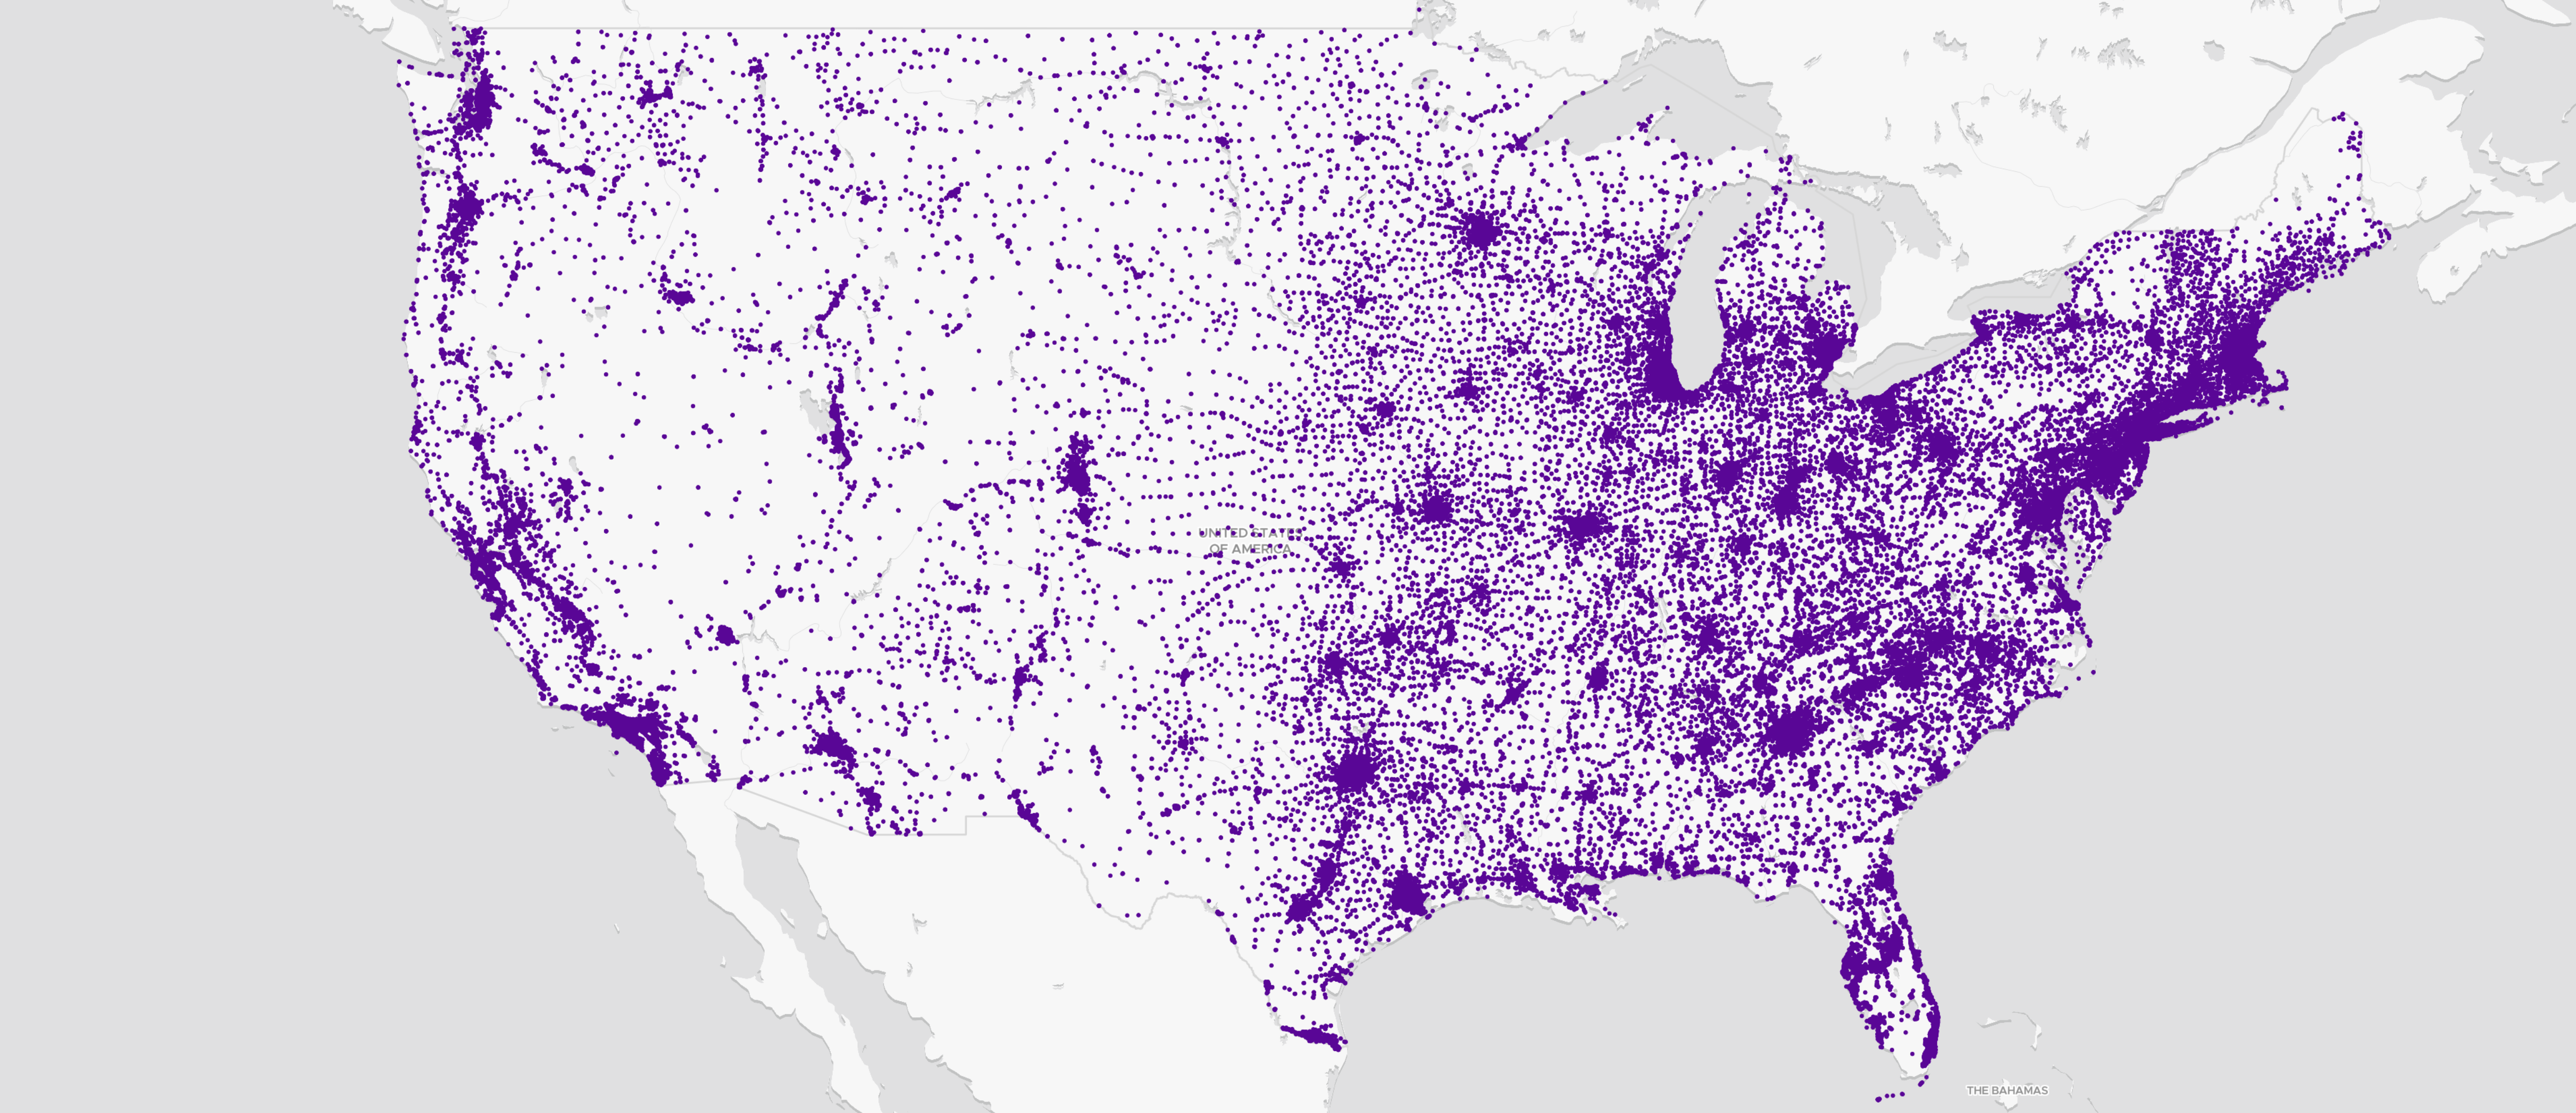
With the point helper, it’s also possible to adapt the color and the radius based on a property. In the following example, we display a point for each public school, with the scaling factor being the number of students:
import { helpers } from "@maptiler/sdk";

helpers.addPoint(map, {
  data: "public-schools.geojson",
  property: "students",
  pointColor: ColorRampCollection.PORTLAND.scale(200, 2000).resample("ease-out-sqrt"),
  pointOpacity: 0.8,
  minPointRadius: 6,
  maxPointRadius: 30,
  showLabel: true,
  zoomCompensation: false,
})
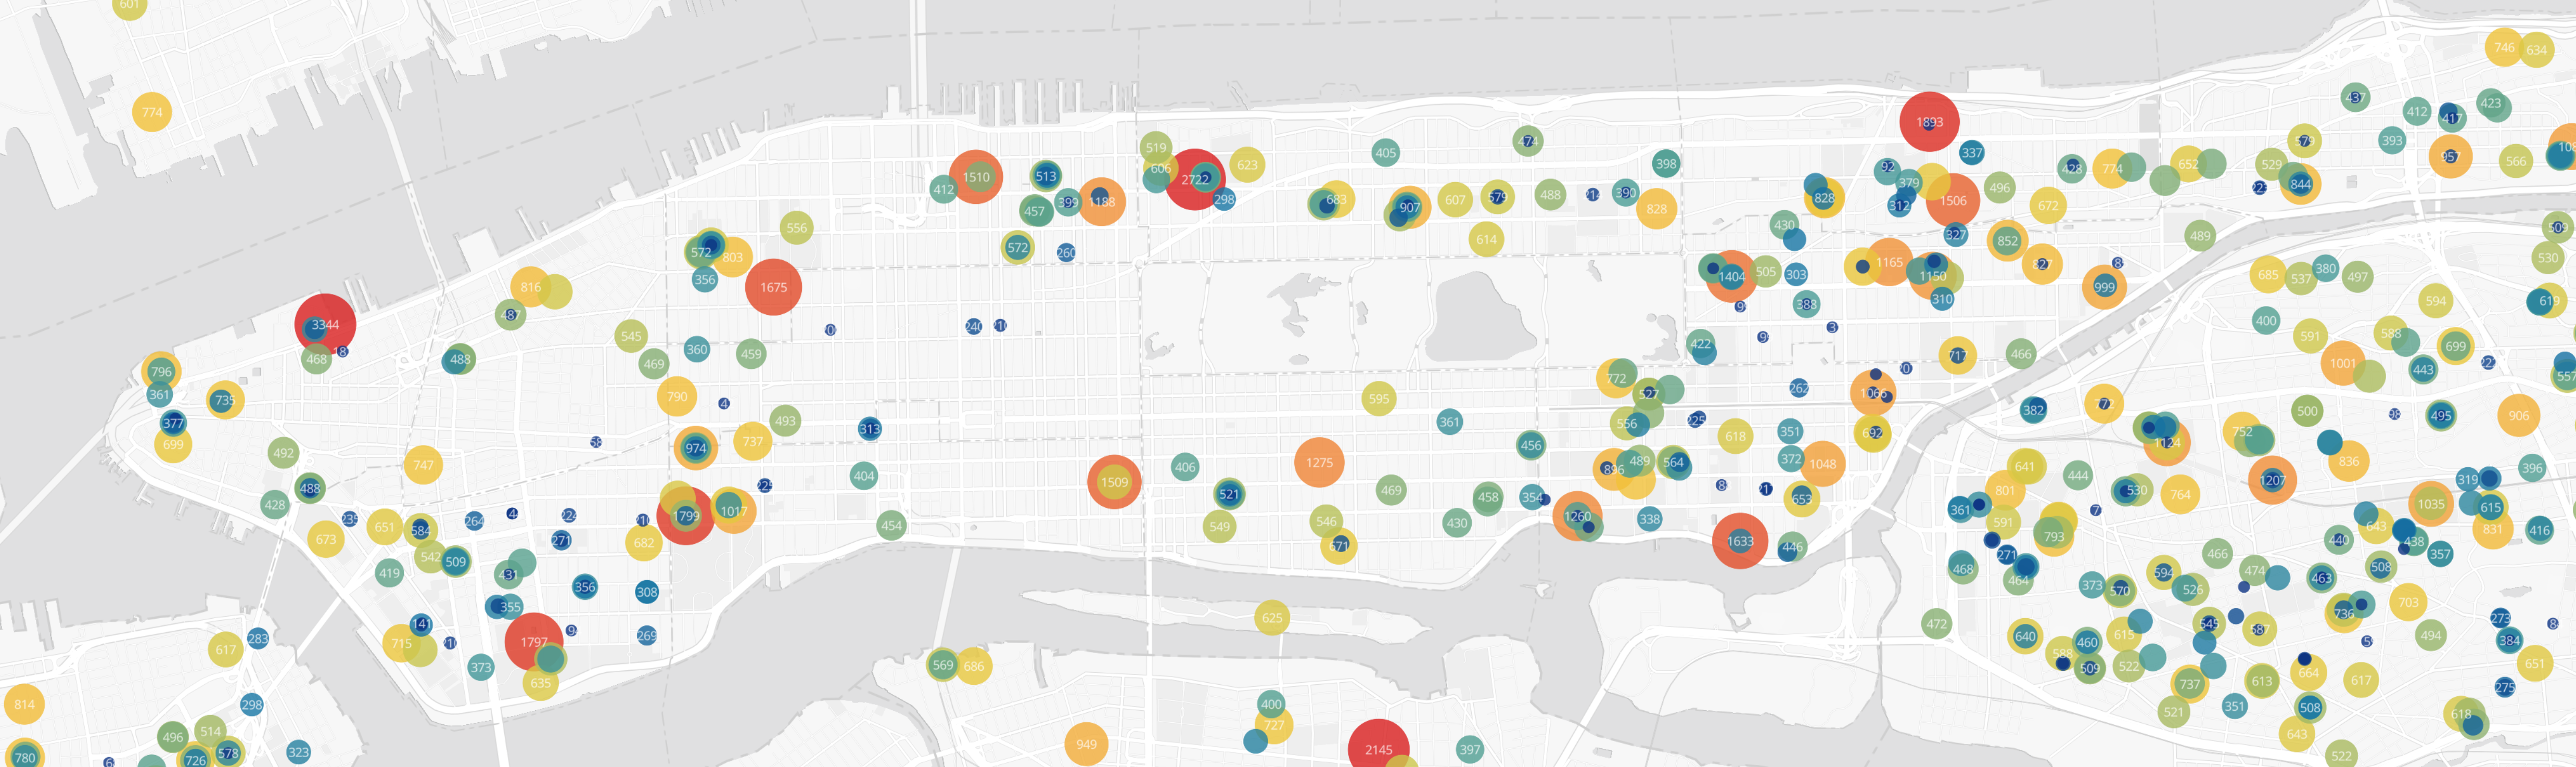
Here, the PORTLAND color ramp is going to be used so that schools with 200 students or less will have the colors at the very begining of the color ramp and schools with 2000 or more will have the color defined at the very end. Schools in between will be attributed a colors in a non-linear fashion, following the "ease-out-sqrt" method (read Color ramps section for more info).
View more Point layer helper examples.
Heatmap layer helper
The heatmap layer is a great alternative for visualizing a collection of sparse data, but they can be challenging to use, especially when one has to come up with their own color ramp from scratch. The helper makes this much easier! Whenever it’s possible and it makes sense, we use the same terminology across the different helpers.
Methods
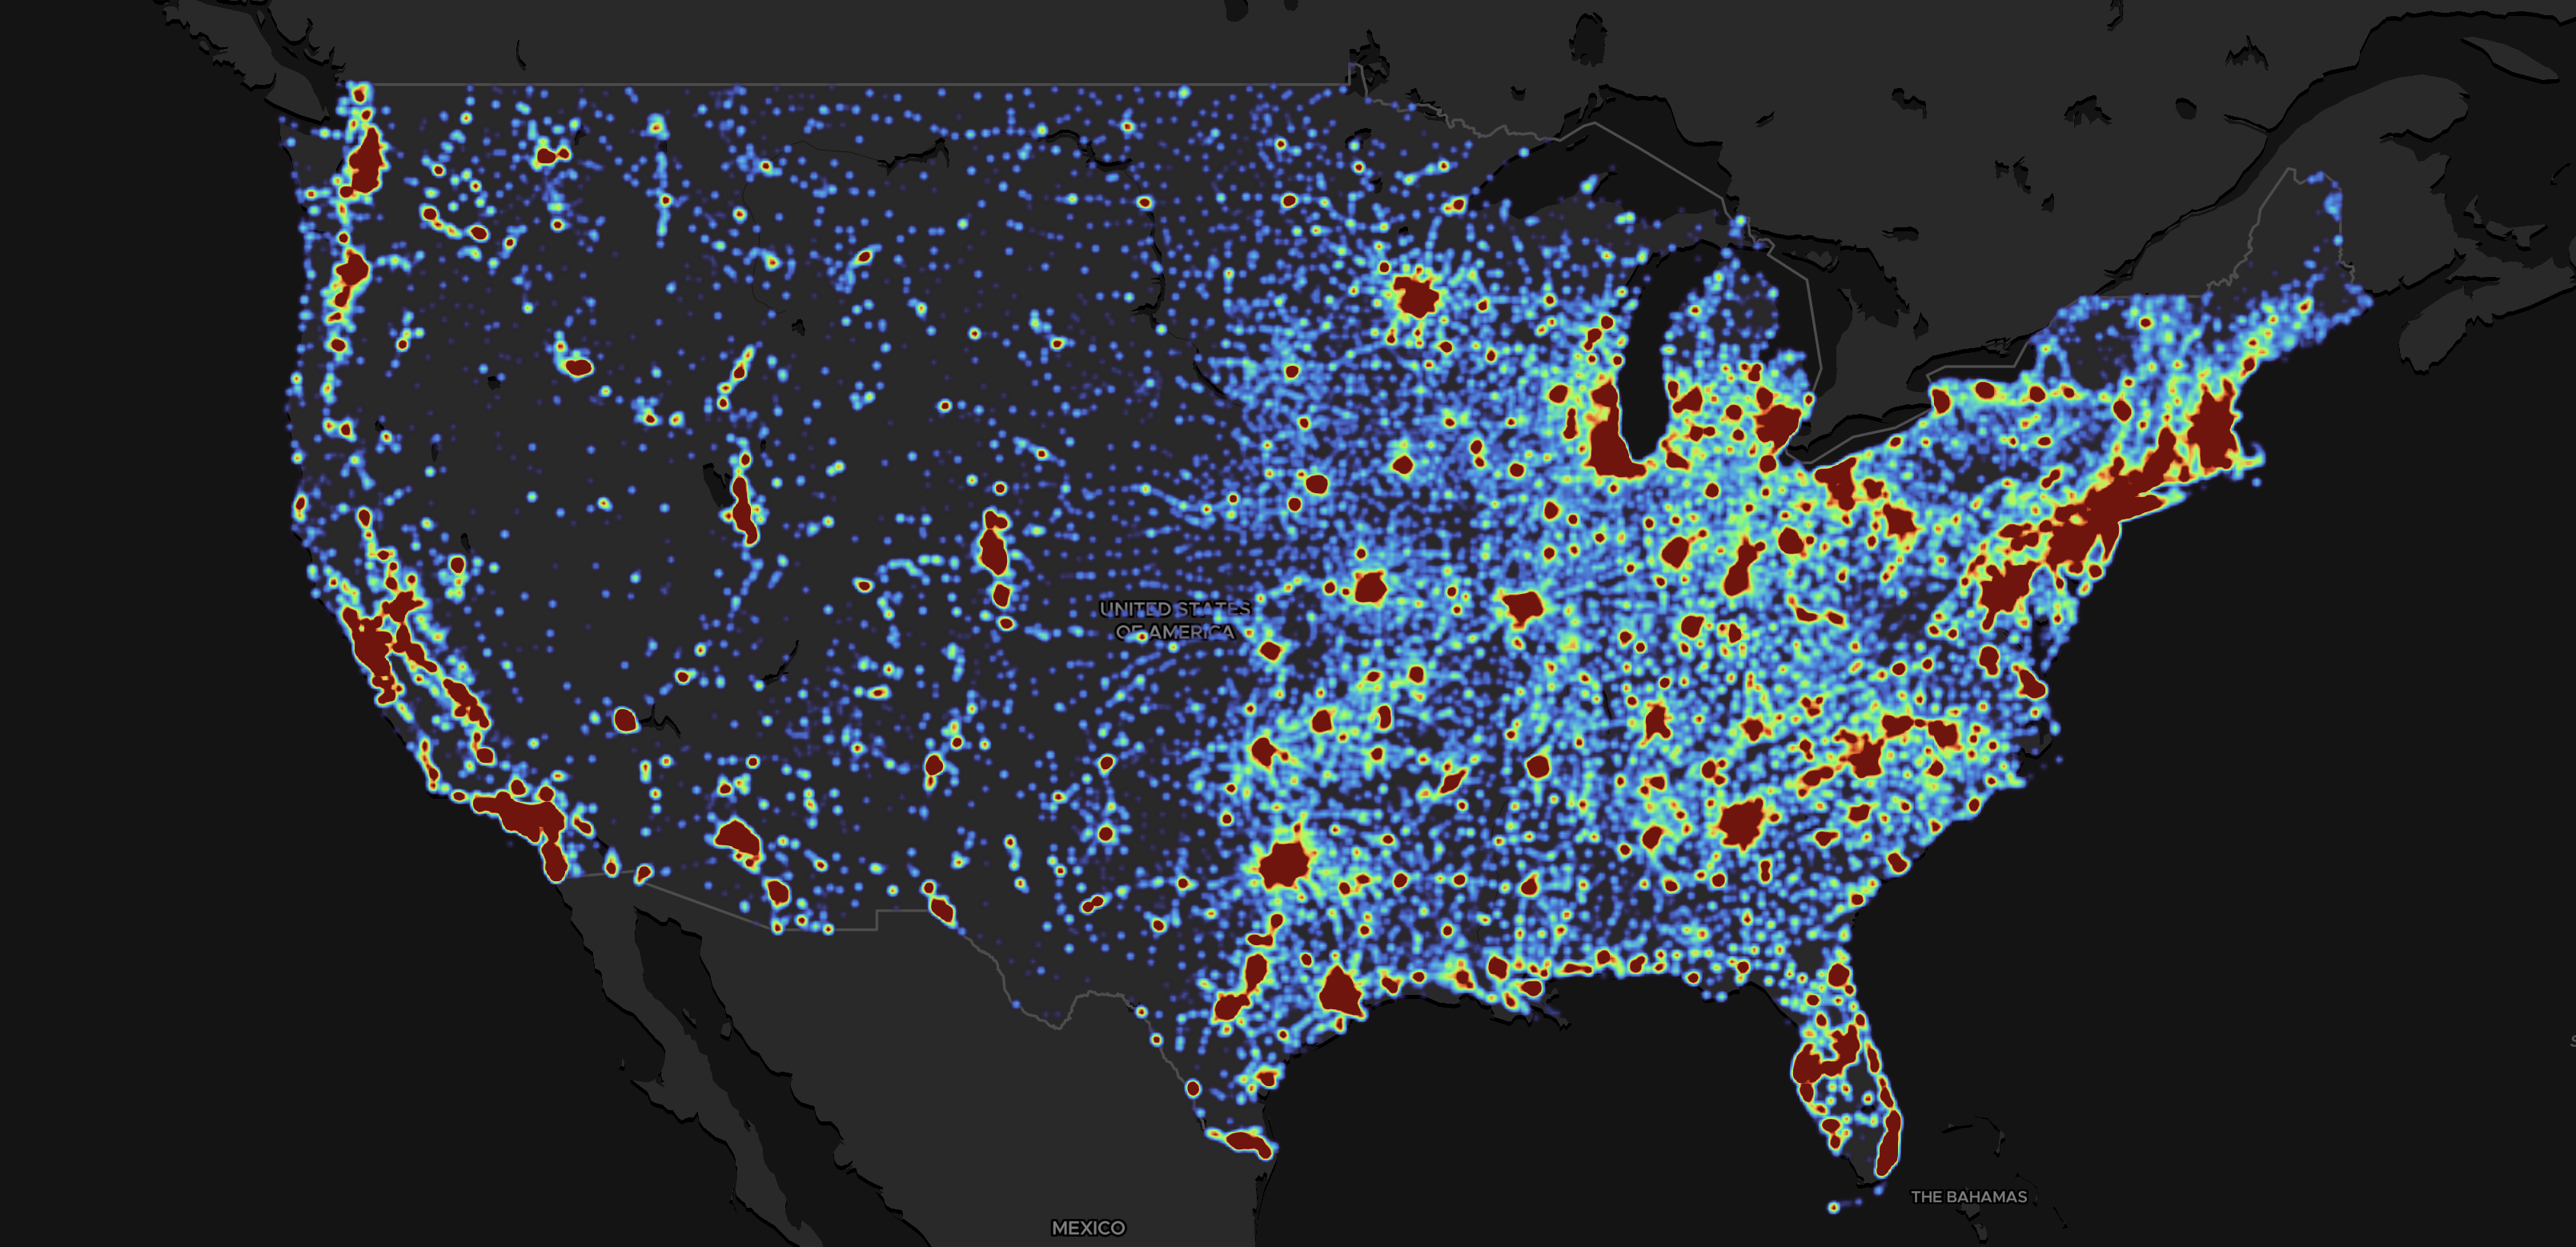
Here is a minimalist example, using the default built-in TURBO color ramp:
import { helpers } from "@maptiler/sdk";

helpers.addHeatmap(map, {
  data: "public-schools.geojson",
});
Add a heatmap with styling options.
Compatible sources:
- uuid of a MapTiler dataset
- geojson from url
- geojson content as string
- geojson content as JS object
The default styling creates a heatmap layer usign the default built-in TURBO color ramp.
Those style properties can be changed and ramped according to zoom level using an easier syntax.
Promise: {
heatmapLayerId: string;
heatmapSourceId: string;
}
HeatmapLayerOptions
| options.layerId? (string)
|
ID to give to the layer. If not provided, an auto-generated ID like "maptiler-layer-xxxxxx" will be auto-generated, with "xxxxxx" being a random string. |
|---|---|
| options.sourceId? (string)
|
ID to give to the source. If not provided, an auto-generated ID like "maptiler-source-xxxxxx" will be auto-generated, with "xxxxxx" being a random string. |
| options.data (
FeatureCollection |
string)
|
A geojson Feature collection or a URL to a geojson or the UUID of a MapTiler dataset. |
| options.beforeId? (string)
|
The ID of an existing layer to insert the new layer before, resulting in the new layer appearing visually beneath the existing layer. If this argument is not specified, the layer will be appended to the end of the layers array and appear visually above all other layers. |
| options.minzoom? (number)
default: 0
|
Zoom level at which it starts to show. |
| options.maxzoom? (number)
default: 22
|
Zoom level after which it no longer show. |
| options.colorRamp?
default:
ColorRampCollection.TURBO |
The ColorRamp instance to use for visualization. The color ramp is expected to be defined in the
range [0, 1] or else will be forced to this range.
|
| options.property? (string)
default: none, the points will all have a weight of
1 |
Use a property to apply a weight to each data point.
Using a property requires also using the options .propertyValueWeight
or otherwise will be ignored.
|
| options.weight? (number |
PropertyValues
)
|
The weight to give to each data point. If of type |
| options.radius? (number |
ZoomNumberValues |
PropertyValues
)
|
Radius in screenspace. Can be:
|
| options.opacity?
default: fades-in 0.25z after minzoom and fade-out 0.25z before maxzoom
|
The opacity can be a fixed value or zoom-driven. |
| options.intensity?
default: the intensity is going to be scaled by zoom to preserve a natural aspect or the data distribution
|
The intensity is zoom-dependent. |
| options.zoomCompensation? (boolean)
default: true
|
If the radius is driven by a property, then it will also scale by zoomming if
.zoomCompensation is true.
If false, the radius will not adapt according to the zoom level.
|
Examples
Check out the full list of examples.
Some visualisations are created with a fixed geographic extent or zoom level in mind, whether it’s a survey at the scale of a single neigbohood, or statitics at country scale. In this case, we want to tailor the color, radius, weight and intensity of the heatmap blobs exactely for this precise settings. In the following example, we disable the zoom compensation to make sure radii and intensity is never zoom-dependant:
import { helpers } from "@maptiler/sdk";

helpers.addHeatmap(map, {
  data: "public-schools.geojson",
  property: "students",
  // radius: how wide are the blobs
  radius: [
    {propertyValue: 100, value: 15},
    {propertyValue: 800, value: 50},
  ],
  // weight: how intense are the blob, as fueled by a property
  weight: [
    {propertyValue: 100, value: 0.1},
    {propertyValue: 800, value: 1},
  ],
  // A custom color ramp, must be used with its default interval of [0, 1]
  colorRamp: ColorRampCollection.MAGMA,
  zoomCompensation: false,
  opacity: 0.6,
  // a global factor applied to all the blobs, regardless of the property or zoom
  intensity: 1.2,
});
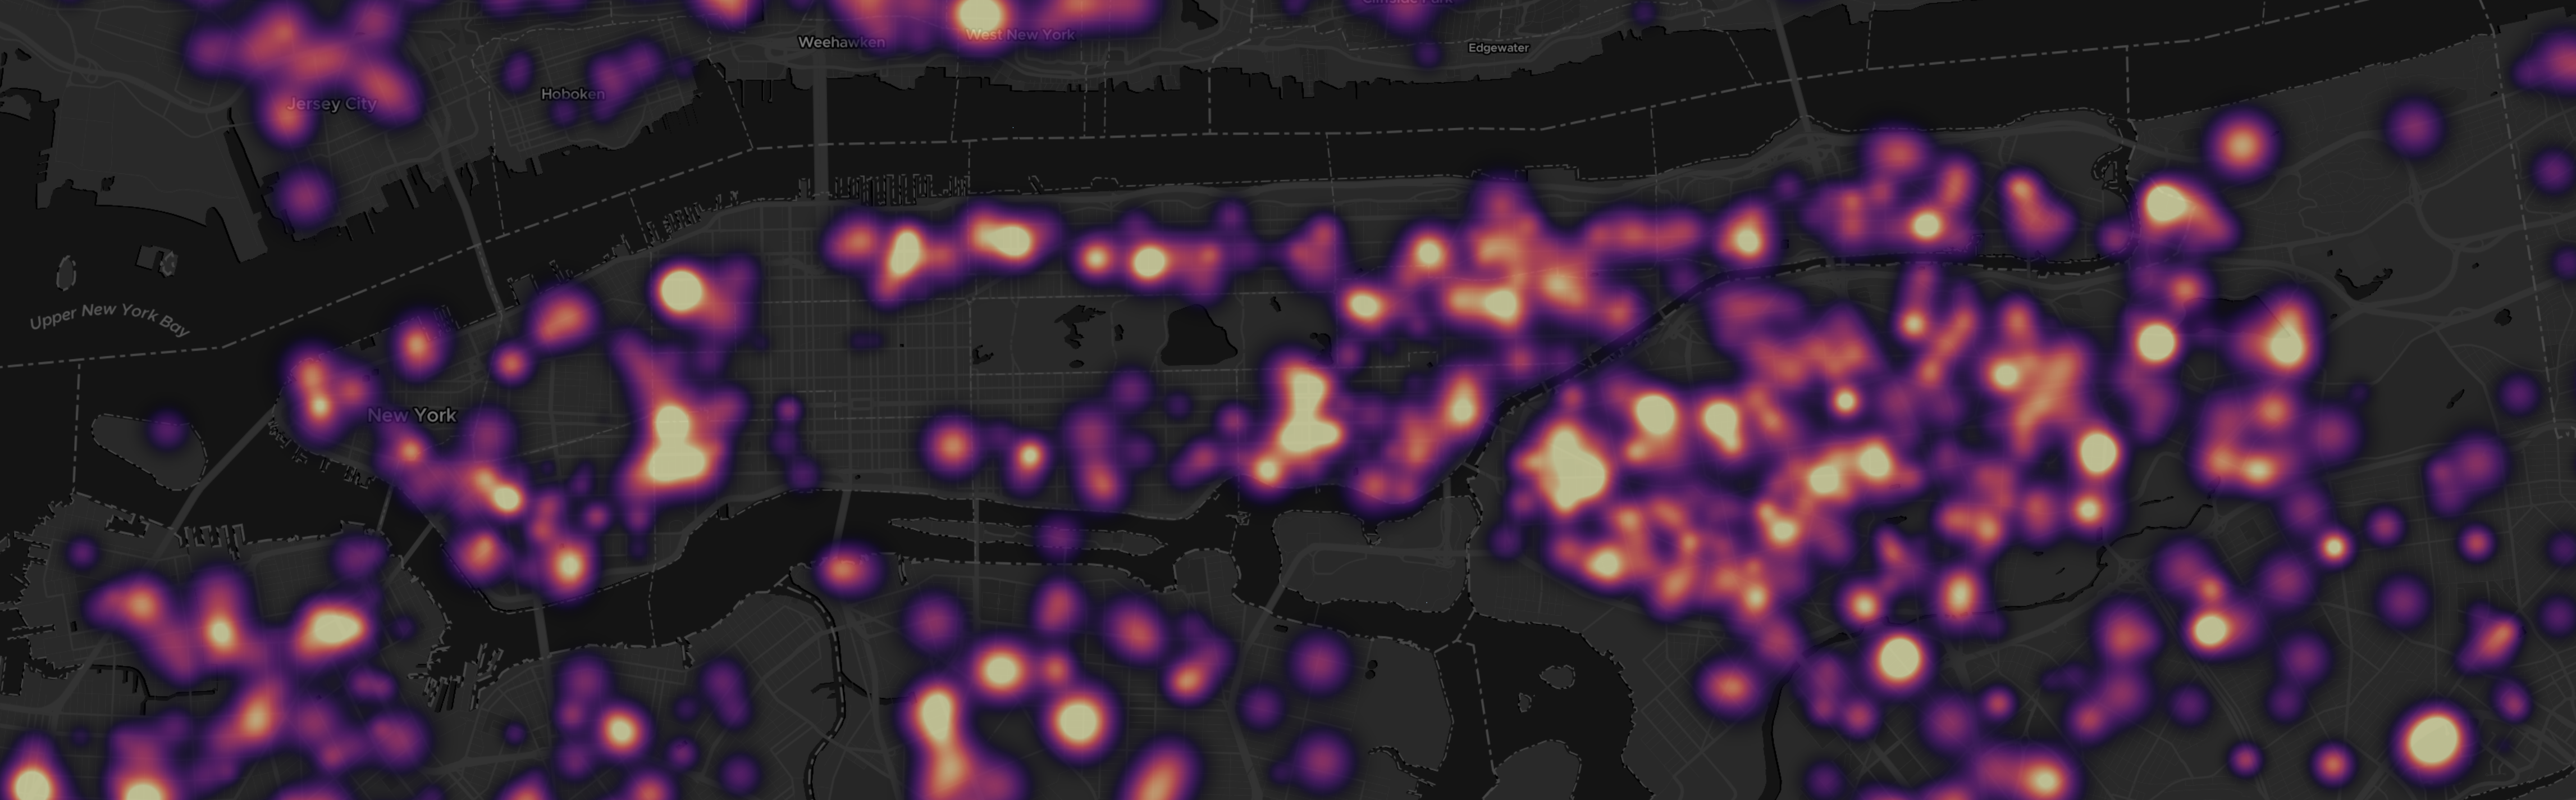
Turning off zoom compensation allows for more accurate adjustments to the visualization at a specific zoom level, but it may not adapt as smoothly when zooming in or out.
View more Heatmap layer helper examples.
Take screenshot helper
The screenshot helper provides a quick and easy solution for capturing the current map view as a PNG image file, making it the most convenient way to save map snapshots.
Warning
Screenshots will not contain DOM elements such as Marker and Popup, since those are not part of the rendering context.
Methods
Here is a minimalist example to get a blob (PNG encoded):
import { Map, helpers } from "@maptiler/sdk";

// ... initialize a Map instance, wait for the "load" or "ready" event ...

// Inside an async function, or with using .then()
const blob = await helpers.takeScreenshot(map);
Takes a screenshot blob (PNG file) of the curent map view.
Depending on the options, this function can automatically trigger a download of the file.
Promise: Blob (PNG encoded)
TakeScreenshotOptions
| options.download? (boolean)
default: false
|
If true, this function will trigger a download in addition to returning a blob.
|
|---|---|
| options.filename? (string)
default: "maptiler_screenshot.png"
|
Only if options.download is true. Indicates the filename under which the file will be downloaded.
|
Examples
Check out the full list of examples.
There are two different ways to create screenshot, corresponding to two very different usecases. Note that screenshots will not contain DOM elements such as Marker and Popup, since those are not part of the rendering context.
Get a blob of a screenshot, PNG encoded
import { Map, helpers } from "@maptiler/sdk";

// ... initialize a Map instance, wait for the "load" or "ready" event ...

// Inside an async function, or with using .then()
const blob = await helpers.takeScreenshot(map);
The returned blob of a PNG image file can be very handy if the goal is to programmatically further manipulate the screenshot, such as sending it to some feedback endpoint with a POST request.
Download a PNG file
import { Map, helpers } from "@maptiler/sdk";

// ... initialize a Map instance, wait for the "load" or "ready" event ...

// No need to be inside an async function, the download will be triggered when the file is ready
maptilersdk.helpers.takeScreenshot(map, {
  download: true,
  filename: "map_screenshot.png"
});
Getting a file directly is a nice option that can be useful to share some debugging context with colleagues, compare multiple styles, or share your creation on social media.
Info
Keep in mind that MapTiler data are copyrighted and their usage is restricted. This include MapTiler built-in styles and tilesets, among others. In case of doubt, do not hesitate to read our terms or to ask our support team.
Other helpers
Convert GPX and KML to GeoJSON
In the Polyline layer helper section above, we have seen that one can feed the helper directly with a path to a GPX or KML file, that is then converted under the hood client-side into a GeoJSON FeatureCollection object. This conversion feature is also exposed and can be used as such:
import { gpx } from "@maptiler/sdk";

// ... assuming inside an async function

// Fetching the GPX file as a string:
const gpxFilePath = "some_gps_trace.gpx";
const gpxResponse = await fetch(gpxFilePath);
const gpxStr = await gpxResponse.text();

// Converting the GPX payload into a GeoJSON FeatureCollection:
const features = maptilersdk.gpx(gpxStr);
//or
const features = gpx(gpxStr);
And for KML files:
import { kml } from "@maptiler/sdk";

// ... assuming inside an async function

// Fetching the KML file as a string:
const kmlFilePath = "some_gps_trace.kml";
const kmlResponse = await fetch(kmlFilePath);
const kmlStr = await kmlResponse.text();

// Converting the KML payload into a GeoJSON FeatureCollection:
const features = maptilersdk.kml(kmlStr);
//or
const features = kml(kmlStr);
Types and interfaces
ZoomStringValues
Array of string values that depend on zoom level
Array<{
  zoom: number, // Zoom level
  value: string // Value for the given zoom level
}>
ZoomNumberValues
Array of number values that depend on zoom level
Array<{
  zoom: number, // Zoom level
  value: number // Value for the given zoom level
}>
PropertyValues
Array<{
  propertyValue: number, // Value of the property (input)
  value: number // Value to associate it with (output)
}>