Map in React JS create a heatmap
Maps in React series
In this series, we will learn how to create a map app in React with popups, a visualization switcher, geocoding control, 3D terrain, and a sidebar.
- Episode 0: Map in React JS with Material UI
- Episode 1: Map in React JS point data from geojson data
- Episode 2: Map in React JS create a heatmap
- Episode 3: Map in React js with popup and sidebar
- Episode 4: Map in React js with geocoding control
- Episode 5: 3D Map in React js with geocoding control
This example is the Episode 2 of the Maps in React series. In this step-by-step tutorial, you’ll learn how to create a heatmap in your React JS map using the MapTiler SDK JS heatmap helper.
In this example, I’ll show you how to create a heatmap visualization of a point dataset and how to switch between this and the points.
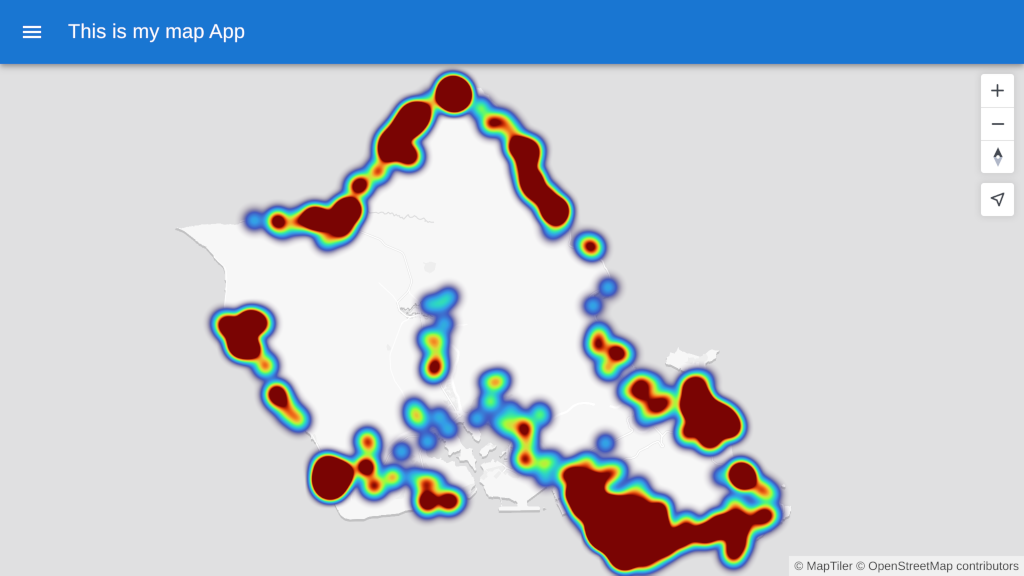
By the end of this tutorial, you will be able to create a heatmap. With your newfound knowledge, you will be able to create visually stunning maps with React + Heatmap + MapTiler SDK. Take a look at the final output of this tutorial below:
-
This tutorial builds on Map in React JS point data from geojson data code. (That tutorial shows how to build a simple full-screen map application with hundreds of points.) Heatmap is a visualization method that shows the spatial density of point data based on attribute weight or simply by spatial distribution.
-
Create a new layer with the heatmap helper. Open the
/src/components/Map/map.jsxfile and add the highlighted lines: -
When use the heatmap visualization on the accommodation dataset for Hawaii, it shows that most of the accommodation is concentrated around the coast. It does this clearly without crowding the map with overlapping points.
-
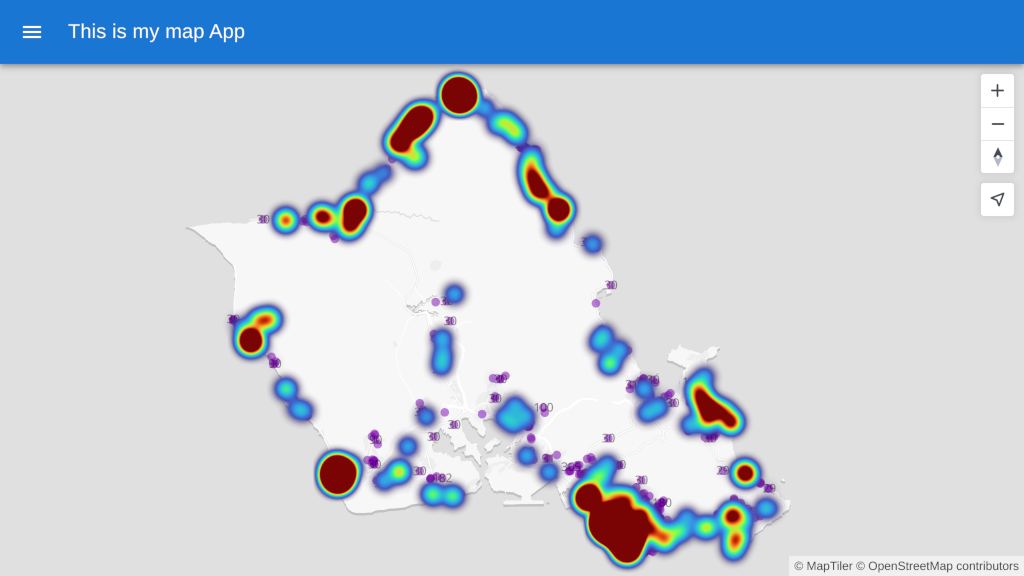
Create a heatmap of accommodation based on the minimum nights’ stay attribute. We can do this by setting up property and weight. In this example, we will exclude accommodation that can only be rented for more than 30 days.
-
Refresh the page and see that some points are now not being included in the calculations for the heatmap. But all the points have the same radius.
-
We will make the radius of the heatmap points also determined by a value of the property defined above.
-
Optional. If you would like to play with heatmap opacity or styling across zoom levels, look at the heatmap helper documentation.
-
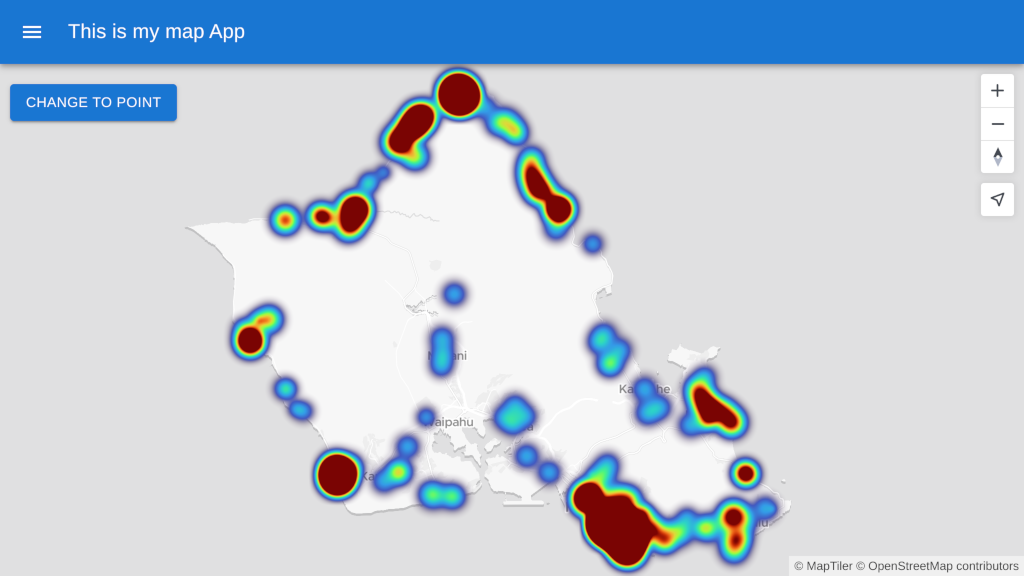
Let’s create the visualization switcher. This will allow users to turn the heatmap back into points, letting them zoom in and identify individual locations.
-
Import the Material UI
Buttoncomponent. -
Create a button. We will use Material UI to style it.
-
In the
handleVisualizationChangefunction, we want to change the selected layer. -
Create
selectedMapLayerstate to show the selected layer. -
In order to switch between visualizations, we need to be able to make layers created by the MapTilerSDK helpers visible or invisible. This means we’ll need to know the ID of each layer. Check out the MapTiler SDK helpers documentation to learn how to get the IDs of each layers.
-
We will use states to prevent errors caused by setting the visibility of a nonexistent layer.
-
Now let’s set the IDs of individual layers.
-
Change layers visibility only after the map is loaded.
setLayoutPropertieshas 3 argumentslayerId,name, andvalue. If the layer is selected, then the visibility should be set tovisibleotherwise it should benone. -
Congratulations! You have created a heatmap, and added a button to your application to switch between displaying the point layer or the heatmap.
Full code to download
We have created a repository with the result of this tutorial that will serve as a basis to build future applications. You can access the repository at ![]() Maps in React.
Maps in React.
Next episode
Continue to Episode 3: Map in React js with popup and sidebar to learn how to create a map with a sidebar and popup in your React JS map using the MapTiler SDK JS.


