Usage analytics for sessions and requests
Your MapTiler account contains a section that gives you exact service usage. This page explains the analytics and advises how to use them.
- Go to Analytics to see your usage visualized in interactive charts.
- Note that requests and sessions are displayed and billed separately.
Periods and filtering
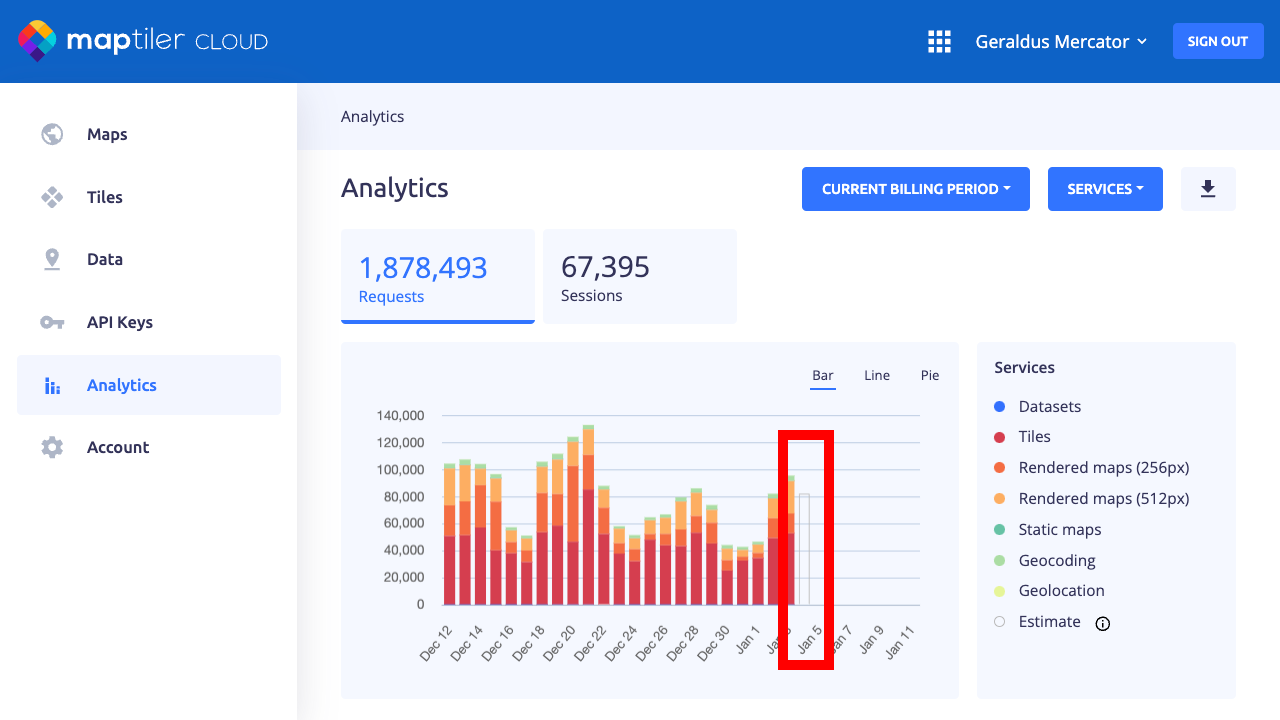
Usage data are aggregated into days or months. Only the whole day is always displayed. Daily statistics are available for the past 90 days or you can display monthly statistics for all the time. Charts display the list of used Services from api.maptiler.com by default. Switching it to view divided by API keys or Service credentials is also possible.

Estimated cost
The estimated amount for the current period is computed as the daily average (of the past 28 days) multiplied by the remaining days. It’s an “extra day” in a chart and it is added to daily periods for 30 or 90 days. Estime is not present in the exported file.
Data export
On the right side, use the Download button to download a CSV file for a filtered view. For export automation, see the API section below.

Filtering by API key
It is highly recommended to always use a designated API key for each of your websites or projects. It’s safer and makes it possible to analyze traffic separately. Don’t forget to set the description and origin for each key.

API for analytics
The API endpoint is available for fetching usage data with Service credentials. There is a possibility to export data in CSV or JSON format. The detailed endpoint description is documented in the API reference.
