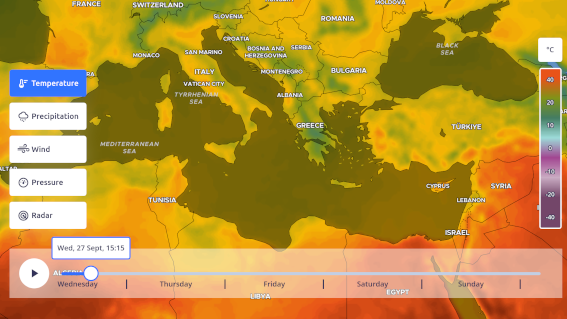
Pressure isolines layer
The PressureIsolineLayer shows the atmospheric pressure isolines in millibar (mbar) or hectopascal (hPa). Forecast for air pressure at mean sea level.

Example
Extends: Isolines layer
Parameters
Options to provide to the Layer constructor
(PressureIsolinesLayerOptions)
| options.id
default: "MapTiler Isoline Pressure"
|
ID of the layer |
|---|---|
| options.colorramp
ColorRamp
default:
ColorRamp.builtin.PRESSURE_4 |
Colormap to use. Maximum range possible spans from 900 hPa to 1080 hPa. Default spans from 900 hPa to 1080 hPa |
| options.opacity
default: 1
|
Opacity of the layer in [0, 1] |
| options.smooth
default: true
|
Whether or not the colorramp must be smooth |
| options.lineThickness
default: 1.0
|
Thickness of the isoline line |
| options.lineColor
Color [R, G, B, A]
default: [0, 0, 0, 40]
|
Color of the isoline lines |
| options.lineColorTen
Color [R, G, B, A]
default: [0, 0, 0, 120]
|
Line color for pressure that are multiples of 10 (980, 990, 1000, etc.) |
| options.renderBlurRadius
default: 4
|
Integer > 0. Blurring is needed to ensure smoothly curved lines. Is used in every animation frame to get best result, but higher values can make animation slower. |
| options.stepForZoomLevels
Array<ZoomLevelStep>
default: [
{ zoom: 0, step: 4 },
{ zoom: 3, step: 2 },
{ zoom: 5, step: 1 }
]
|
Lines densities for zoom levels. |
Methods
Check out the Isolines layer methods and the Layers method reference
Get the air pressure in hPa (or mbar) at a given location
Object: the value(s) as an object.
| value | Air pressure in hPa (or mbar) |
|---|
Events
Check out the Layers events reference
