How to display an interactive choropleth map legend control
This tutorial shows how to display an interactive choropleth map legend control.
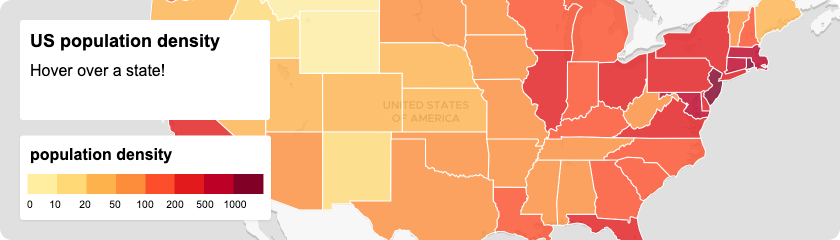
Discover the functionality of the legend control by hovering your mouse over the colored boxes in the legend, which allows you to filter the different countries on the map. Additionally, when you hover over a specific country, you will be able to view its population.
Move the mouse over the colored boxes of the legend to filter the elements of the map. Move the mouse over a country to see the population
-
Copy the following code, paste it into your favorite text editor, and save it as a
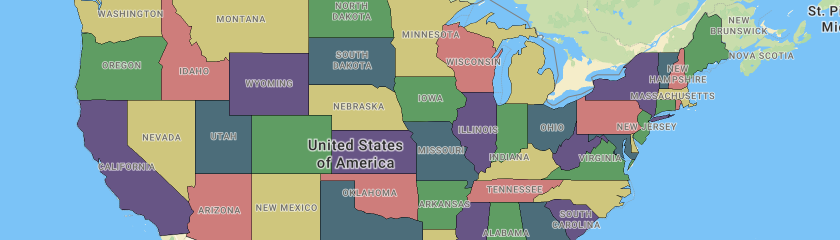
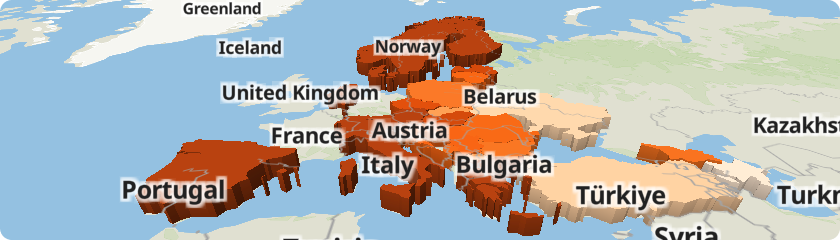
.htmlfile. This code is the result of doing steps 1 to 12 of the tutorial How to create a countries map with your own data -
Include the
chroma-jsJavaScript file in the<head>of your HTML file. To create the legend we will use the chroma-js library. We are going to use the library to create the color scale and create the class breaks based on thevizData. -
Get the population data from vizData.
-
Create the data equidistant breaks and the scale color. To do these calculations you can use any other library such as D3.js.
-
Create a function to round the limits numbers. Now we have values in our limits matrix that are neither integers nor rounded. This is not a problem in itself, but in this case we want to have the legend with ranges of integers, for example categories between 100 - 1000, 1000 - 5000, etc. and not have ranges with numbers like 354 - 1013, 1013 - 5278, etc.
-
Create a function to create the choropleth map based on the breaks (limits) and color scale.
-
Create a choropleth map based on the population attribute. Change the
fill-colorproperty of the layer and get the color from thecreatePaintColorfunction. -
Create a file called
legendControl.jsnext to your.htmlfile. Copy the following code, paste it into thelegendControl.jsfile. -
Add the mouse events listener to the map.
-
Create the legend html.
-
Create the
choroplethLegendControlstyle. Add the choroplethLegendControl style to your stylesheet. -
Include the
legendControl.jsJavaScript file in the <head> of your HTML file. -
Add the
choroplethLegendControlto the map. -
We already have the legend on our map. Now we’re going to add some functionality to the legend to make it interactive and allow you to filter items on the map. Back to the
legendControl.js. -
Add the functionality to show the information of the selected element on the map in the legend. Hovering over a country with data will display the population in the corresponding category in the legend.
-
Create a popup to show the country info. In your
.htmlfile before creating the legendchoroplethLegendControladd the following lines: -
Add the popup to the
choroplethLegendControlconstructor options. -
Showing a popup when hovering over a country with data will show the population information. In the
legendControl.jsfile update thelegendHighlightfunction. Add de coordinates parameter and popup functionality. -
Hide the popup when move. Update the
clearLegendHighlightfunction. -
Update the
_mousemovefunction.
Learn more
Check out the How to use and filter data for MapTiler Countries tutorial.
Visit the MapTiler Countries schema to know how it is organized into different thematic layers and which attribute and values each layer contains.
Consult the JavaScript Maps API reference to learn about Ramps, scales, curves.
Read the following How-tos related to choropleth maps:
How to style a choropleth map in Edit Tool
Prepare GeoJSON with attributes for choropleth map and upload GeoJSON to MapTiler