---
title: "Map in React JS point data from geojson data | React | JavaScript maps SDK"
description: "Add GeoJSON points to React JS maps with MapTiler."
---
> For AI agents: a documentation index is available at [/llms.txt](https://docs.maptiler.com/llms.txt). Markdown versions of all pages are available by appending .md to any URL.
# Map in React JS point data from geojson data
## Maps in React series
In this series, we will learn how to create a map app in React with popups, a visualization switcher, geocoding control, 3D terrain, and a sidebar.
- Episode 0: [Map in React JS with Material UI](https://docs.maptiler.com/react/sdk-js/get-started-material-ui/)
- **Episode 1: Map in React JS point data from geojson data**
- Episode 2: [Map in React JS create a heatmap](https://docs.maptiler.com/react/sdk-js/heatmap/)
- Episode 3: [Map in React js with popup and sidebar](https://docs.maptiler.com/react/sdk-js/popup-sidebar/)
- Episode 4: [Map in React js with geocoding control](https://docs.maptiler.com/react/sdk-js/geocoding-control/)
- Episode 5: [3D Map in React js with geocoding control](https://docs.maptiler.com/react/sdk-js/3d-map/)
This example is the **Episode 1** of the Maps in React series. In this step-by-step tutorial, you’ll learn how to add geojson points to your React JS map using the MapTiler SDK JS point helper.
By the end of this tutorial, you will be able to create a map with hundreds of points. With your newfound knowledge, you will be able to create visually stunning maps with React + GeoJSON + MapTiler SDK. Take a look at the final output of this tutorial:
In this example we are going to use [Airbnb accommodation data from Honolulu](https://docs.maptiler.com/sdk-js/assets/Honolulu_Arbnb.geojson). We have cleaned up the data and selected only a few properties for the practical purposes of the example.
1. Follow the [Map in React JS with Material UI](https://docs.maptiler.com/react/sdk-js/get-started-material-ui/) tutorial to create a simple full-screen map application.
2. Change the basemap to Dataviz Light. This style is specially made for dashboards, so the data will shine more on it than on the street style, which was made primarily for navigation apps. You can find the [full list of standard maps](https://docs.maptiler.com/sdk-js/api/map-styles/) in the MapTiler SDK documentation. Modify the map component `src/components/Map/map.jsx`.
```jsx
map.current = new maptilersdk.Map({
container: mapContainer.current,
style: maptilersdk.MapStyle.DATAVIZ.LIGHT,
center: [center.lng, center.lat],
zoom: zoom
});
```
3. Remove the marker from the map. In this example we are going to add data to the map from a GeoJSON so we will not need the marker anymore. Delete the following lines:
```diff-jsx
- new maptilersdk.Marker({color: "#FF0000"})
- .setLngLat([-157.858677, 21.3067])
- .addTo(map.current);
```
4. Change the title of the page. Open the `index.html` file
```html
Honolulu Accommodation
```
5. Upload the GeoJSON file to the MapTiler cloud. Check out the [How to Upload GeoJSON to MapTiler](https://docs.maptiler.com/guides/maps-apis/maps-platform/prepare-geojson-with-attributes-for-choropleth-map-and-upload-geojson-to-maptiler-cloud) tutorial to learn how to do it. Publish the dataset and copy the dataset ID.
6. Update the `src/config.js` file.
```js
export default {
MAPTILER_API_KEY: "YOUR_MAPTILER_API_KEY_HERE",
MAPTILER_DATSET_ID: "YOUR_DATASET_ID_HERE",
};
```
Here you will need to replace `YOUR_DATASET_ID_HERE` with your actual [MapTiler dataset ID](https://cloud.maptiler.com/data).
7. Modify the map component `map.jsx` file. Create a variable where we will store the ID of our dataset.
```jsx
const [zoom] = useState(9.79);
const geodata = configData.MAPTILER_DATSET_ID;
maptilersdk.config.apiKey = configData.MAPTILER_API_KEY;
```
8. Add event handler for map load event. You will add code to load a GeoJSON layer in this handler.
```jsx
map.current.on("load", () => {
});
```
9. Use the [Point Layer Helper](https://docs.maptiler.com/sdk-js/api/helpers/#point) to load and style the GeoJSON point layer.
```jsx
map.current.on("load", () => {
maptilersdk.helpers.addPoint(map.current, {
data: geodata,
});
});
```
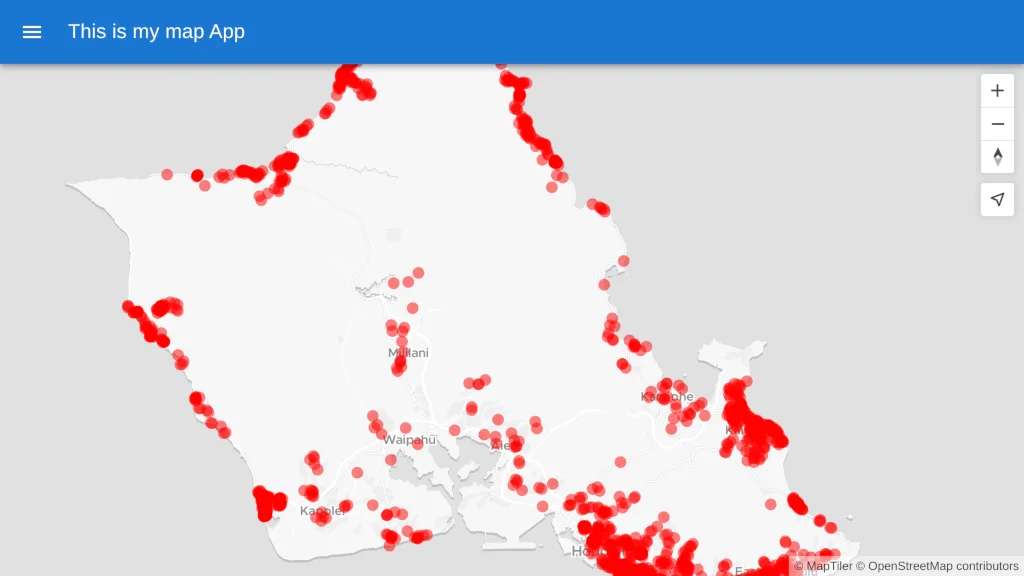
10. Set the points color to red (if no color is specified, a random color is used) and specify the opacity as well. This can make the points a little less intense and easier on the eye.
```jsx
map.current.on("load", () => {
maptilersdk.helpers.addPoint(map.current, {
data: geodata,
pointColor: "#ff0000",
pointOpacity: 0.5,
});
});
```
11. Reload the page, now we can see our red dot maps with transparency.
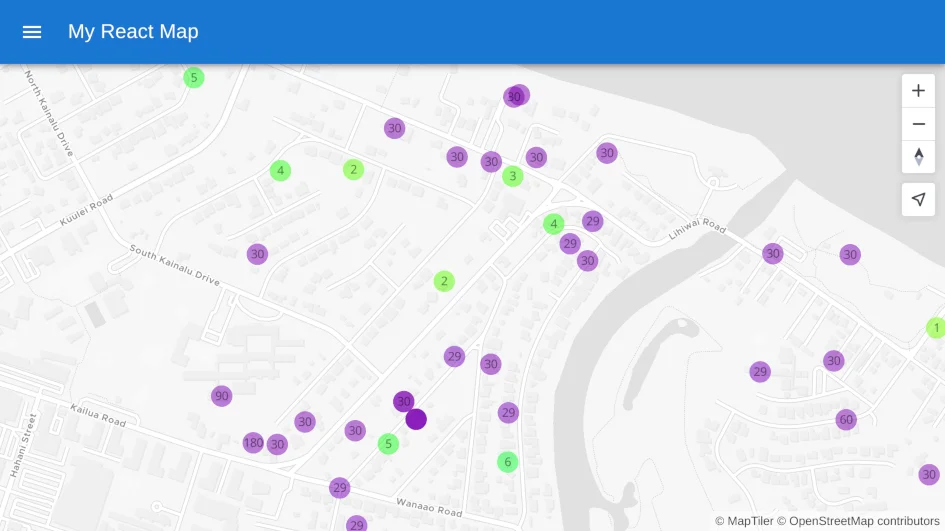
12. Let’s color each point based on the value of an attribute in the data. In the example we will use the `minimum_nights` attribute. The MapTiler SDK comes with several [built-in color Ramps](https://docs.maptiler.com/sdk-js/api/color-ramp/). We are going to use the COOL color ramp. By setting the `scale` from 0 to 30 and applying the `reverse` method. You should be able to see the Airbnb that you can only rent for more than a month (the purples ones).
```jsx
map.current.on("load", () => {
maptilersdk.helpers.addPoint(map.current, {
data: geodata,
pointColor: maptilersdk.ColorRampCollection.COOL.scale(0, 30).reverse(),
property: "minimum_nights",
pointOpacity: 0.5,
});
});
```
13. This is good for an overview, but we’d like to see the exact number of minimum nights, so let’s add some labels.
```jsx
map.current.on("load", () => {
maptilersdk.helpers.addPoint(map.current, {
data: geodata,
pointColor: maptilersdk.ColorRampCollection.COOL.scale(0, 30).reverse(),
property: "minimum_nights",
pointOpacity: 0.5,
showLabel: true,
});
});
```
14. That’s better, but you can’t really read the labels on the green dots, so let’s change the color of the labels to black.
```jsx
map.current.on("load", () => {
maptilersdk.helpers.addPoint(map.current, {
data: geodata,
pointColor: maptilersdk.ColorRampCollection.COOL.scale(0, 30).reverse(),
property: "minimum_nights",
pointOpacity: 0.5,
showLabel: true,
labelColor: "black",
});
});
```
15. As you can see the size of the dots depends on the length of the minimum stays. We don’t need this when the color already shows it. Therefore, we will set the radius of the dots to 12.
```jsx
map.current.on("load", () => {
maptilersdk.helpers.addPoint(map.current, {
data: geodata,
pointColor: maptilersdk.ColorRampCollection.COOL.scale(0, 30).reverse(),
property: "minimum_nights",
pointOpacity: 0.5,
showLabel: true,
labelColor: "black",
pointRadius: 12,
});
});
```
16. With everything done up until now, you should be able see your beautiful map in your browser.
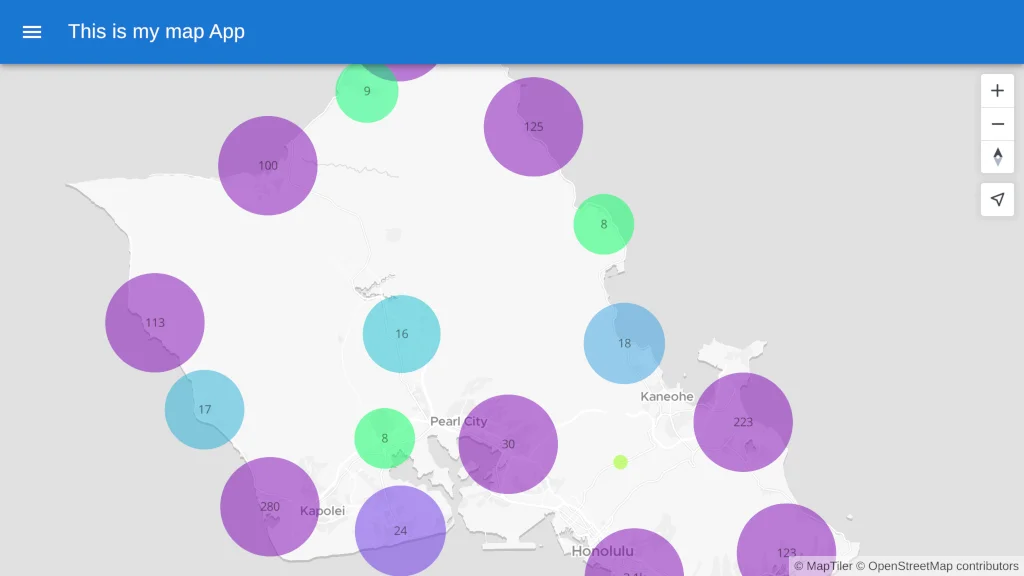
**Optional**. Point helpers can also create clusters, so you don’t need to use anything like a 3rd party plugin to do this. Simply set Cluster to be true! It couldn’t be easier!
```jsx
map.current.on("load", () => {
maptilersdk.helpers.addPoint(map.current, {
data: geodata,
pointColor: maptilersdk.ColorRampCollection.COOL.scale(0, 30).reverse(),
property: "minimum_nights",
pointOpacity: 0.5,
showLabel: true,
labelColor: "black",
cluster: true,
});
});
```
This is how the cluster map would look. In this visualization, the size of the circles corresponds to the number of accommodations, and the labels also show the number of accommodations in the cluster.
## Full code to download
We have created a repository with the result of this tutorial that will serve as a basis to build future applications. You can access the repository at [Maps in React](https://github.com/maptiler/maps-in-react/tree/E1-Add-geojson-data).
## Next episode
Continue to [Episode 2: Map in React JS create a heatmap](https://docs.maptiler.com/react/sdk-js/heatmap/) to learn how to create a heatmap in your React JS map using the MapTiler SDK JS.
## Related examples
### [Learn the basics - React](https://docs.maptiler.com/react/)
Tutorials
Create React JS components for MapTiler SDK JS maps.
### [Geocoding component - React](https://docs.maptiler.com/react/sdk-js/geocoding-component/)
Tutorials
Search places using Geocoding control component in React JS.
### [Map with Material UI](https://docs.maptiler.com/react/sdk-js/get-started-material-ui/)
Tutorials
Create React JS maps with Material UI and MapTiler.
### [Heatmap in React JS](https://docs.maptiler.com/react/sdk-js/heatmap/)
Tutorials
Create heatmap visualizations in React JS maps using MapTiler.
### [Popup and sidebar - React](https://docs.maptiler.com/react/sdk-js/popup-sidebar/)
Tutorials
Create popups and sidebars in React JS maps.
### [Geocoding control - React](https://docs.maptiler.com/react/sdk-js/geocoding-control/)
Tutorials
Add geocoding control to React JS maps using MapTiler.
### [3D Terrain Map](https://docs.maptiler.com/react/sdk-js/3d-map/)
Tutorials
Create 3D terrain maps with geocoding in React JS.